-
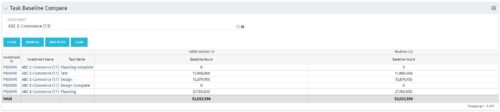 The Task Baseline Compare portlet displays the tasks in a specific Investment and provides the ability to compare the baseline hours for the tasks in each version of the baseline.
 -
The Task Baseline Compare portlet displays the tasks in a specific Investment and provides the ability to compare the baseline hours for the tasks in each version of the baseline.
-
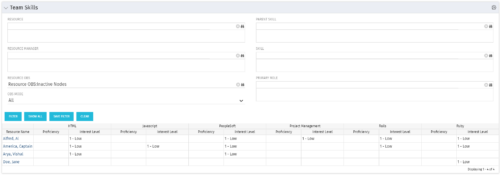 The Team Skills portlet displays Skill Proficiency and Interest Level by Resource. Users can utilize this view to search for Resources by Skill, Parent Skill, Interest, Role, Parent Role, Resource and Resource OBS. This portlet grants a Project Manager or Resource Manager the ability to determine which Resources best fit the needs for their project.
 -
The Team Skills portlet displays Skill Proficiency and Interest Level by Resource. Users can utilize this view to search for Resources by Skill, Parent Skill, Interest, Role, Parent Role, Resource and Resource OBS. This portlet grants a Project Manager or Resource Manager the ability to determine which Resources best fit the needs for their project.
-
 The Investment Resource Rate portlet allows a user to search for effective (or missing) rates for resources across all investment types. It pulls rate information from the matrix extraction tables and includes currency conversion if the environment supports multiple currencies. The portlet can be used both to search for the rate of any given resource and to determine which resources might be missing rates when an error is generated when attempting to populate a cost plan (REVMGR-20728:Rates and Costs are both missing for one or more roles/resources).
 -
The Investment Resource Rate portlet allows a user to search for effective (or missing) rates for resources across all investment types. It pulls rate information from the matrix extraction tables and includes currency conversion if the environment supports multiple currencies. The portlet can be used both to search for the rate of any given resource and to determine which resources might be missing rates when an error is generated when attempting to populate a cost plan (REVMGR-20728:Rates and Costs are both missing for one or more roles/resources).
-
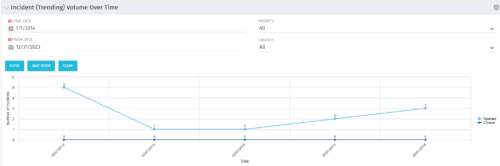 This view depicts trends of created and resolved Incidents over time, grouped by month. The count of incidents opened is determined by the Created Date of the Incident, and the count of Incidents closed is determined by the Resolution Date of the Incident. The view is filterable by Priority and Urgency as well as a date range. NOTE: The values returned are the total sum for a given month, not a cumulative total over time.
 -
This view depicts trends of created and resolved Incidents over time, grouped by month. The count of incidents opened is determined by the Created Date of the Incident, and the count of Incidents closed is determined by the Resolution Date of the Incident. The view is filterable by Priority and Urgency as well as a date range. NOTE: The values returned are the total sum for a given month, not a cumulative total over time.
-
 Pie Chart displays count of all Ideas by Department. Filterable by Active and Inactive, by OBS, and by Department Manager. Data label and mouse-over show department counts. Legend displays department names.


Copyright 2023 • Rego Consulting Corporation • Privacy Policy