-
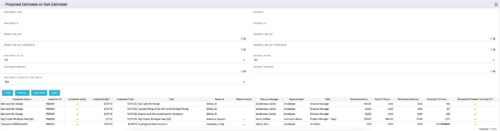 The Proposed Estimates vs. Task Estimates portlet gives the ability to identify when the Proposed Estimates for any given task exceed the Task Estimates. The portlet filters by investment name, investment ID, project OBS unit, investment active (yes/no/all), investment manager, resource name, resource ID, resource OBS unit, resource active (yes/no/all), and resource manager. Additionally, the results can be filtered by the proposed ETC greater than task ETC flag (yes/no/all). The information provided on the portlet includes the investment name, investment ID, investment active (yes/no), investment start/end dates, task name, resource name, resource active (yes/no), resource manager, total hours, total ETC, proposed ETC greater than task ETC flag (yes/no), pending actual hours, and proposed ETC hours.
 -
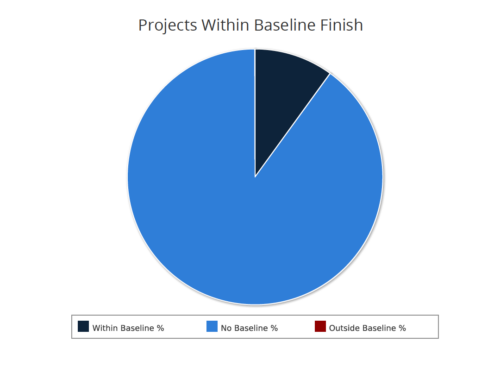 Projects within baseline finish report is a pie chart that displays projects that have a baseline or do not have a baseline. Projects with baseline are further segregated into within or outside baseline finish. Mouse over on the pie chart displays the % of projects within a particular category. You can further narrow your search by OBS Type & Path, Project Finish Date and Is Project Active?.
 -

 Pie Chart displays projects by Baseline Finish Variance—is current project finish beyond baseline finish; or is current project finish on or before baseline finish. Filterable by OBS structure and Finish Date range. Data labels show percent within baseline vs percent outside baseline. Mouse-over shows Within or Outside label and percent of total projects. Legend shows color coded Within Baseline and Outside Baseline labels. Drilldown: Clicking on a pie slice yields a grid portlet of projects either Within or Outside Baseline.
 -
Pie Chart displays projects by Baseline Finish Variance—is current project finish beyond baseline finish; or is current project finish on or before baseline finish. Filterable by OBS structure and Finish Date range. Data labels show percent within baseline vs percent outside baseline. Mouse-over shows Within or Outside label and percent of total projects. Legend shows color coded Within Baseline and Outside Baseline labels. Drilldown: Clicking on a pie slice yields a grid portlet of projects either Within or Outside Baseline.
-
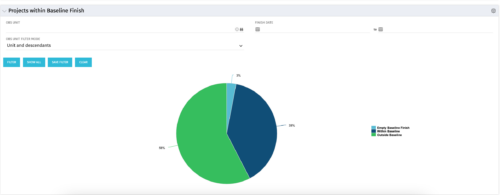 The Projects Within Baseline Finish portlet displays all projects that have a baseline and presents them in a pie chart. This portlet provides management with a way to quickly view the number of projects that are on time. The user may filter by OBS and finish date.
 -
The Projects Within Baseline Finish portlet displays all projects that have a baseline and presents them in a pie chart. This portlet provides management with a way to quickly view the number of projects that are on time. The user may filter by OBS and finish date.
-
The Projects Within Baseline Finish portlet displays all projects that have a baseline and presents them in a pie chart. This portlet provides management with a way to quickly view the number of projects that are on time. The user may filter by OBS and finish date.
-
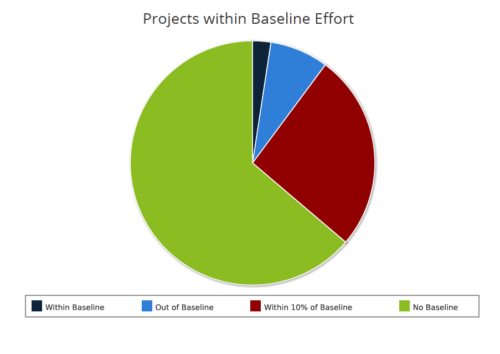 Projects within baseline effort report is a pie chart that displays projects baseline effort by their categories. Legend displays various baseline effort categories: Within Baseline, Out of Baseline, Within 10% Baseline and No Baseline. Mouse over on the pie chart displays the total number of projects within that particular category. You can further narrow your search by OBS Type & Path and Is Project Active?.
 -
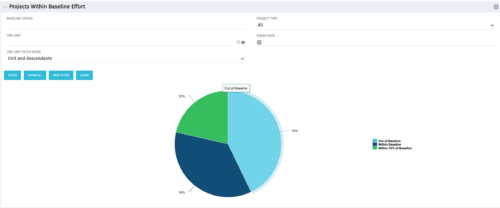 The Projects Within Baseline Effort portlet will display all projects’ baseline effort in a pie chart by three different categories: Out of Baseline, Within Baseline, and Within 10% of Baseline. This portlet is used by the PMO to provide management with a snapshot of all projects and their baselines.
 -
The Projects Within Baseline Effort portlet will display all projects’ baseline effort in a pie chart by three different categories: Out of Baseline, Within Baseline, and Within 10% of Baseline. This portlet is used by the PMO to provide management with a snapshot of all projects and their baselines.
-
 The movement from managing technology organizations and development by Products instead of Projects has grown in recent years. This has many advantages, but only if there are critical changes in defining and funding the development. First, we shift from defining specific solutions to developing and defining the outcomes we want to accomplish with that development. Second, we should rethink how we fund development. Instead of funding a specific scope of work, we should fund the capacity to develop products.


Copyright 2023 • Rego Consulting Corporation • Privacy Policy