-
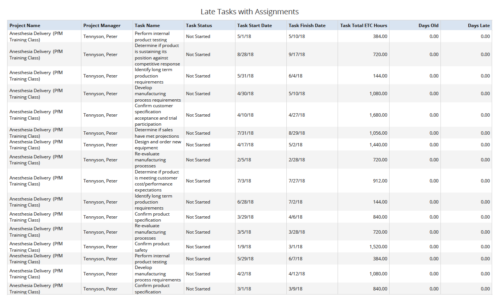 Late Tasks with Assignments report displays the list of all Tasks (with their Total ETC Hours) that are not closed but are past their finish date or past their baseline finish date. The report provides Project Manager the ability to view and track late tasks across multiple projects without going into each project individually. This report displays Project Name, Project Manager, Task Name, Task Status, Task Start Date, Task Finish Date, Days Old (Elapsed days between Task Finish Date and Today's Date), Days Late (Elapsed days between Task Finish date and Task Baseline Finish date). User can further narrow their search by Task Name, Task Status, Project ID, Project Name, Project Manager, Is Milestone?, Is late?, Task Start Date, Task Finish Date and Is Template?. User can use exact dates or relative dates for Task Start Date and Task Finish Date filter parameters.
 -
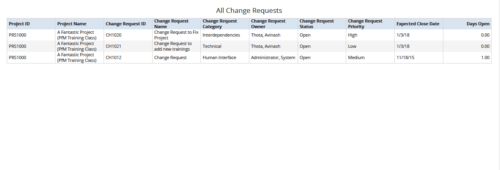 All Change Requests report provides the project manager a single place to view change requests across multiple projects. This report displays Project Information such as ID & Name, Change Request Information such as its ID, Name, Category, Owner, Status, Priority, Expected Close Date and Days Open. You can further narrow your search by OBS Type & Path, Change Request Status, Change Request Name, Change Request Category, Change Request Owner, Project Name and Project Manager.
 -
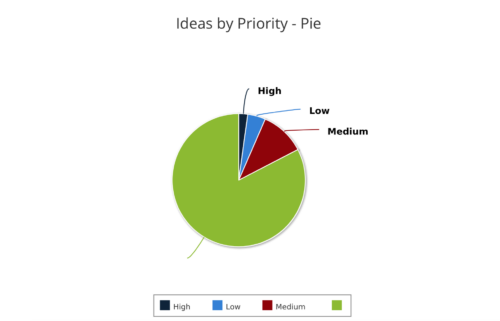 Ideas by Priority report is a pie chart that displays ideas count by priority. Mouse over on the pie chart displays idea count for that priority. You can further narrow your search by OBS Type, OBS Path, Idea Status, Idea Start Date and Is Idea Active?
 -
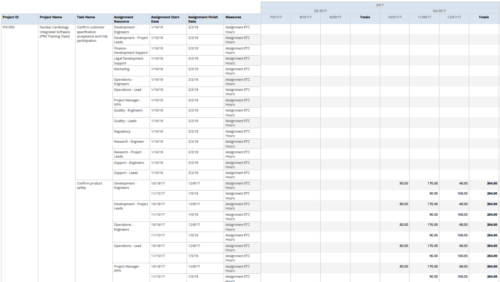 Assignments by Task Over Time report display all assignments by task for all resources. Information can be drilled down to yearly, quarterly or monthly level. This report helps in determining the tasks a user is assigned to or how many hours a user is assigned to a task. You can further narrow your search by OBS Type & Path, Project ID, Project Name, Task Name, Assignment Resource, Is project Active?, Is Template? And Month End date.
 -
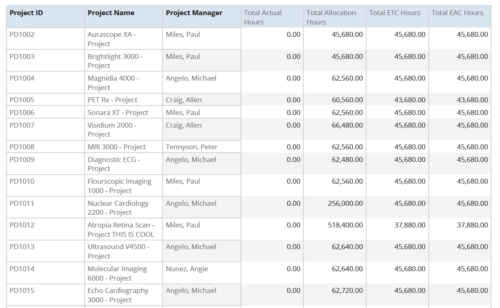 Project Time Summary report provides the project manager a single place to view Actual hours, Allocation hours, ETC hours and EAC hours for all filtered projects. It also displays Project ID, Project Name and Project Manager. User can further narrow their search by OBS Type & Path, Project Name, Project ID, Project Manager, Task Name, Project Status, Project Stage, Project Role, Is Active? and Is Template?.
 -
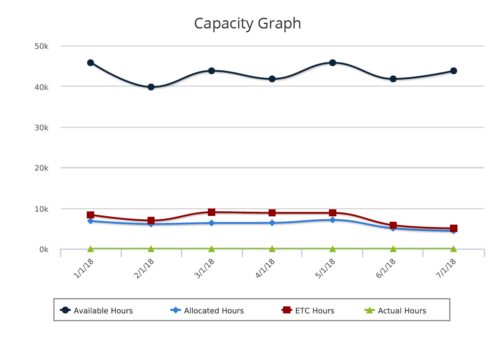 Capacity Graph report provides the Resource Managers & PMO a single place to view Monthly Availability, Allocations, Actuals and Assignments for one or more active resources. Information is displayed in the form of a line chart. Legend displays the color associated with each metric. Mouse over the line chart displays hours associated with that corresponding metric. This report provides Managers a simple means to analyze: Allocations vs. Availability, Allocations vs. Actuals, Allocations vs. ETC and ETC vs. Availability and helps in determining the areas of improvement. User can further narrow their search by OBS Type & Path, Month Start Date, Resource Name, Resource Manager, Primary Role & Employment Type.
 -
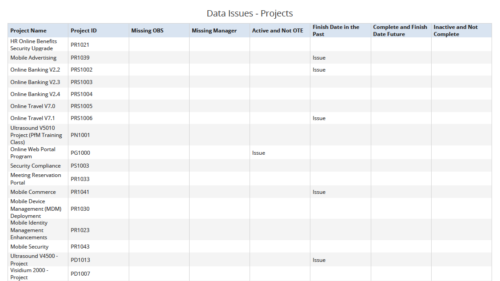 Data Issues – Projects report displays data exceptions related to projects. Data exceptions could be missing data or data not in required format for those project fields. User can further narrow their search by OBS Type & Path, Project Name, Project ID and Project Type.
 -
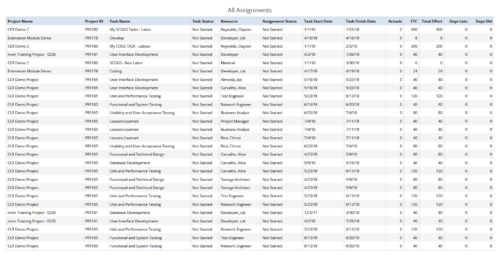 All Assignments report provides the Managers a single place to view all the assignments associated with a project(s). User can view only the investments that he has access to. This report also displays ETC, Actuals, Total Effort, Days Old (Elapsed days between Task Finish Date and Today's Date), Days Late (Elapsed days between Task Finish date and Task Baseline Finish date) associated with the task. You can further narrow your search by OBS Type & Path, Resource Name , Project Manager, Project Name, Project ID, Is project Active?, Assignment Start Date, Assignment Finish Date, Assignment Status and Task Status.
 -
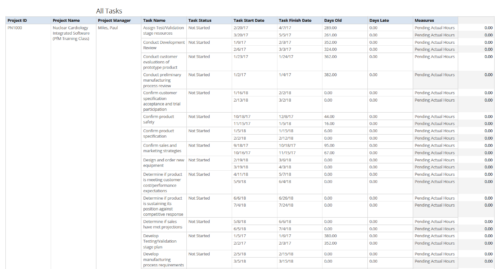 All Tasks report provides the Project Managers a single place to view all the tasks associated with a project(s). User can view only the investments that he has access. Project Managers can use this report to view the progress of the tasks and check how the tasks are performing against baseline date. User can further narrow their search by OBS Type & Path, Investment Name, Month Start Date and Is Project Active?.
 -
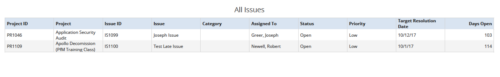 All Issues report provides the Project Managers a single place to view all the Issues across multiple projects. User can view only the projects that he has access to. This report provides Issue information such as ID, Name, Category, Assigned To, Status, Priority, Target Resolution Date and Days Open ( # of days Issue is open ) User can further narrow their search by OBS Type & Path, Issue Name, Project Name, Project ID, Is Project Active?, Issue Owner, Issue Status, Issue Target Resolution Date, Issue Category and Issue Priority.
 -
 All Risks report provides the project manager a single place to view risks across multiple projects. This report displays Project Information such as ID, Name & Manager, Risk Information such as its ID, Name, Owner, Status, Probability, Impact, Target Resolution Date & Days Open. You can further narrow your search by Risk Status, Risk Name Risk Impact, Risk Owner, Project Name and Project Manager.
 -
 Late Milestones report displays the list of all milestones that are not closed but are past their finish date or past their baseline finish date. The report provides Project Manager the ability to view and track late milestones across multiple projects without going into each project individually. This report displays Project ID, Project Name, Project Manager, Milestone Name, Due Date, Baseline Date, Days Late (Elapsed days between Task Finish date and Task Baseline Finish date), and Days Old (Elapsed days between Task Finish Date and Today's Date). User can further narrow their search by Project ID, Project Name, Project Manager Name, Milestone Name, Due Date between, Baseline Date between, Is Milestone?, Is late?, Task Status, Is Template?. User can use exact dates or relative dates for Due Date between and Baseline Date between filter parameters.
 -
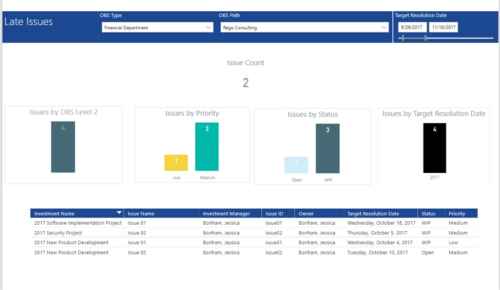 Late Issues report provides the Project Managers a single place to view all the Open Issues that are past their target resolution date. This report provides information such as Issue Count, Issues by OBS Level 2, Priority, Status and Target Resolution Date in Stacked Column Chart. In addition, this report has also Table view of Issue information such as Investment Name, Issue Name, Investment Manager, Issue ID, Owner, Target Resolution Date, Status and Priority. User can further narrow their search by OBS Type & Path and Target Resolution Date.
 -
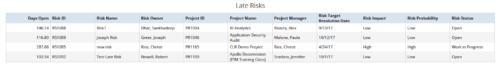
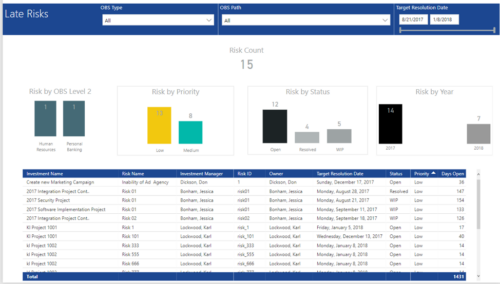 Late Risk report provides the Project Managers a single place to view all the Open Risks that are past their target resolution date. This report provides information such as Risk Count, Risks by OBS Level 2, Priority, Status and Year in Stacked Column Chart. In addition, this report has also Table view of Risk information such as Investment Name, Risk Name, Investment Manager, Risk ID, Owner, Target Resolution Date, Status, Priority and Days Open. User can further narrow their search by OBS Type & Path and Target Resolution Date.
 -
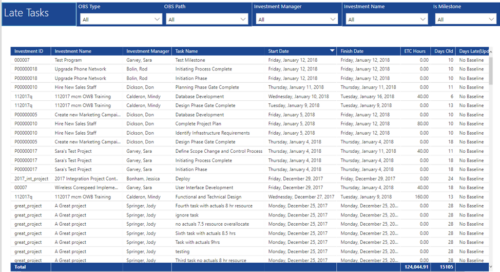 Late Tasks report provides the Project Managers a single place to view all the Tasks that are past their baseline finish date. This report provides information such as Investment ID, Investment Name, Investment Manager, Task Name, Start Date, Finish Date, ETC Hours, Days Old and Days Late in Table view. User can further narrow their search by OBS Type & Path, Investment Manager, Investment Name and whether the Task is a Milestone or not.
 -
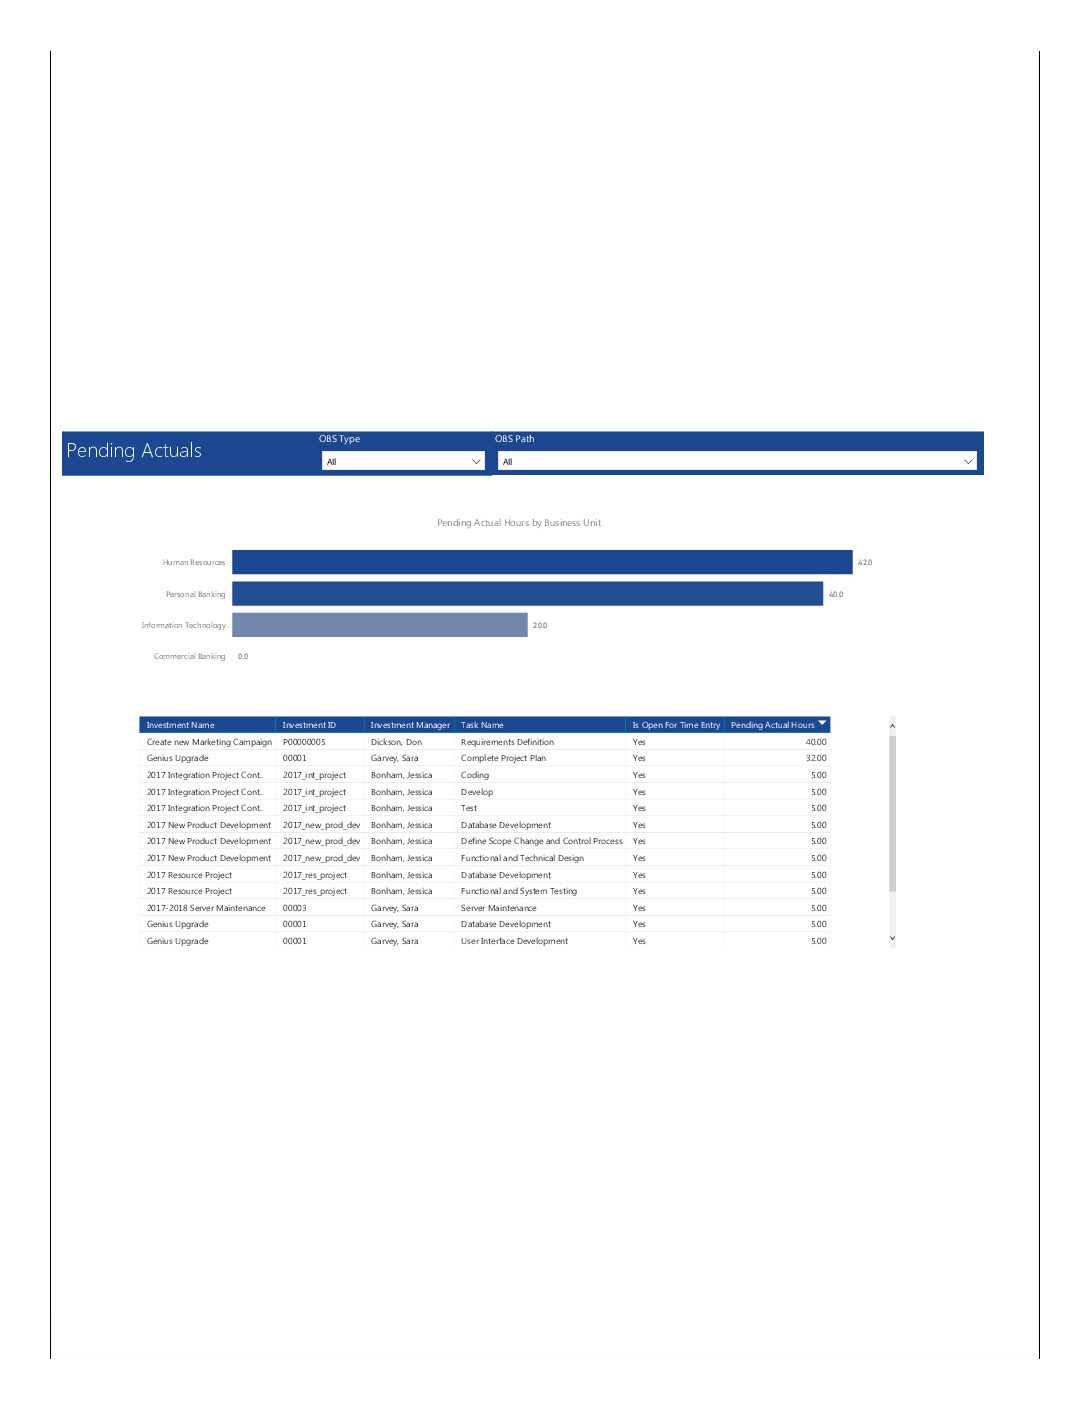 Pending Actuals report provides the Project Managers a single place to view all the pending actuals on tasks across multiple projects. This report provides graphical representation (bar chart) of pending actual hours by business unit. User can further drill down the details by clicking on particular business unit Managers can use this portlet to analyze the actuals that have been submitted but not posted on tasks. You can further narrow your search by OBS Type & Path.
 -
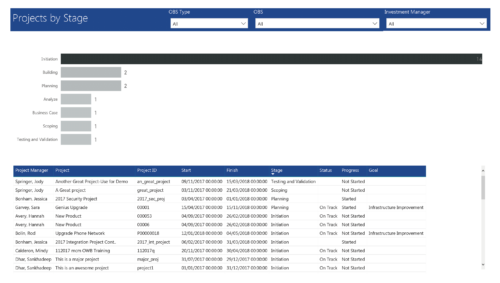 Project by Stage is a bar chart that displays count of projects by out of box Stage attribute. Stage attribute values are plotted on Y axis. Label on the bar chart slice displays the count of projects associated with that respective Stage value. User can further drill down the information to investment level by clicking on particular bar slice. You can further narrow your search by OBS Type & Path, Investment Manager.
 -
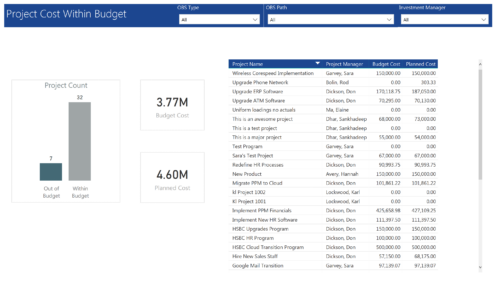 Project Cost within Budget report displays count of projects that are within or exceeding budget in the form of a bar chart. It also displays Total budget cost and Planned cost. User can further drill down the details to investment level. You can further narrow your search by OBS Type & Path and Investment Manager.
 -
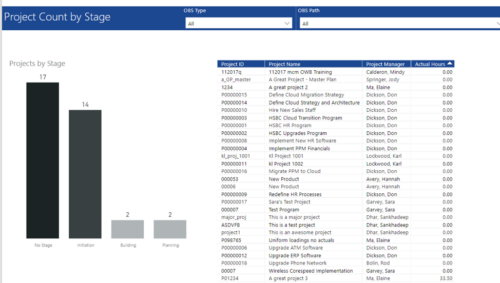 Project Count by Stage report has Stacked Column chart that displays count of Projects by Stage such as Initiation, Building, Planning etc. Also, there is a table view with Project ID, Project Name, Project Manager and Actual hours details. User can further narrow their search by OBS Type & Path.
 -
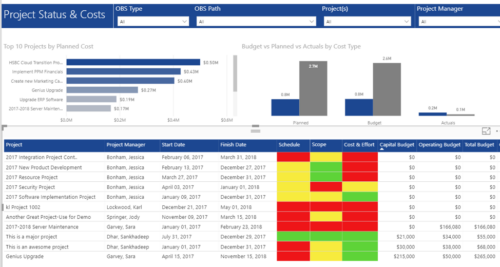 Project Status and Costs report has the details of the Project Schedule, Scope, Cost and Effort Statuses along with Planned, Budget & Actuals costs. There is also graphical representation that shows Top 10 projects by Planned Cost, Budget vs Planned vs Actuals by Cost Type. User can further narrow their search by OBS Type & Path, Project(s) and Project Manager.
 -
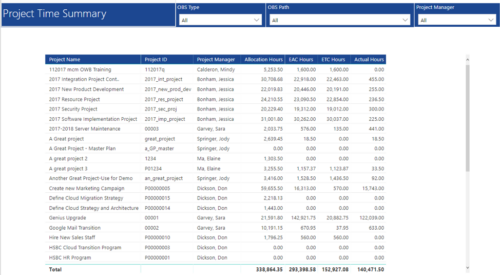 Project Time Summary report provides view of Allocation hours, EAC hours, ETC hours and Actual hours for Projects. User can further narrow their search by OBS Type & Path and Project Manager.
 -
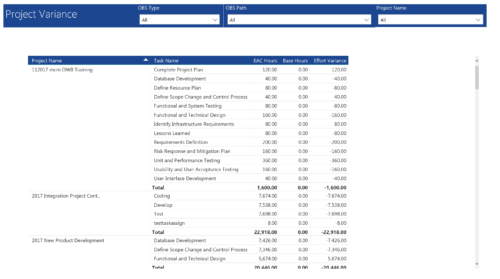 Project Variance report provides project managers a single place to view all their active projects, open tasks, Task EAC hours, Task Baseline hours and their variance. Project Managers can use this report to view and manage their projects progress against their baselines. They can easily detect the projects that are running behind and pinpoint the tasks that are causing the variance in the schedule. You can further narrow your search by OBS Type, OBS Path and Project.
 -
 Project Manager- Resource/Compliance report provides project managers a single place to view Compliance status for various critical KPIs. All the KPIs are depicted in various visualizations.
- Unfilled Demand: Donut chart that gives you the count of roles (within projects) that are not filled by resources.
- # Of New team members: Scorecard that displays the count of new team members added to the projects.
- Resource Constraints: Donut chart that gives you the count of Over utilized and underutilized resources
- Unsubmitted Time: Dial gauge that displays the count of resources that did not submit time.
- Stale Tasks: Dial gauge that displays the count of tasks that are past their due date
- Status Report Compliance: Dial gauge that displays the compliance of status reports for various projects.
-
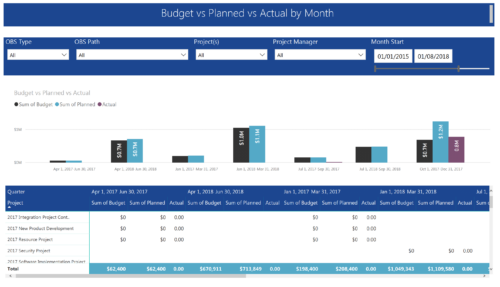 Project Budget vs Planned vs Actual by Month report provides the Project Managers a single place to view Project Budget, Planned and Actual Cost for multiple projects. This report displays Project Budget vs Planned vs Actual by Month in the form of clustered bar chart over a period of time. User can further drill down the information to investment level by selecting a particular bar within the chart. User can further narrow their search by OBS Type & Path, Project(s), Project Manager, Month Start and End Date.


Copyright 2023 • Rego Consulting Corporation • Privacy Policy