-
 What should I expect to see within my organization related to PM over the next couple of years? How should I prepare my PMs, PMOs, or myself to embrace the new trends within the industry. This class will share Rego's observations on industry trends within PPM.
 -
 This training document is a Rego Consulting Quick Reference Guide to assist with use of the Common Grid. You can find the grid throughout the application to manage projects, tasks, roadmaps, ideas, and timesheets to name a few. The QRG reviews View Options, Column Adjustments, the Details Panel and more.
 -
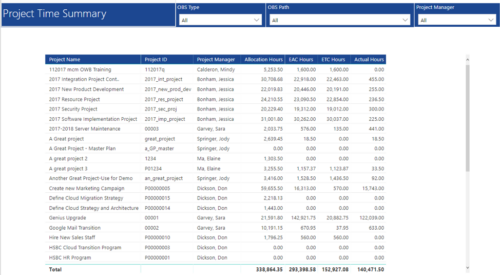 Project Time Summary report provides view of Allocation hours, EAC hours, ETC hours and Actual hours for Projects. User can further narrow their search by OBS Type & Path and Project Manager.
 -
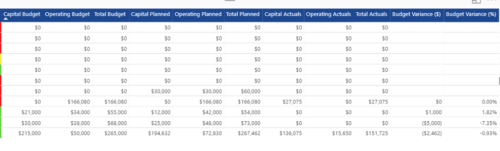
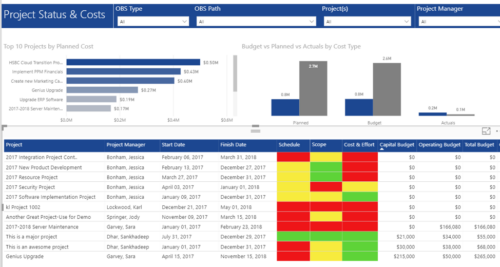 Project Status and Costs report has the details of the Project Schedule, Scope, Cost and Effort Statuses along with Planned, Budget & Actuals costs. There is also graphical representation that shows Top 10 projects by Planned Cost, Budget vs Planned vs Actuals by Cost Type. User can further narrow their search by OBS Type & Path, Project(s) and Project Manager.
 -
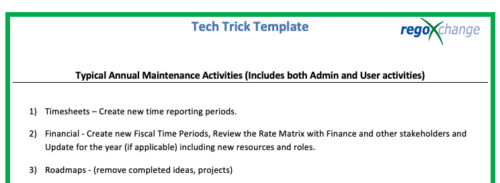 This is a list of 12 typical maintenance items that should be completed for Clarity on an annual basis. There is also a short list of items that should be completed periodically depending on client policies.
 -
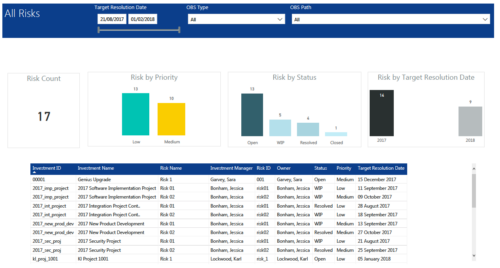 All Risks report provides project managers a single place to view KPIs related to Risks. All the KPIs are depicted in various visualizations. Risk Count: Scorecard that displays the # of Risks for the selected criteria. Risk Priority: Column chart that displays # of Risks by Priority. X axis displays various Risk Priorities. Data labels indicate the number of Risks associated with that category. Risk by Status: Column chart that displays # of Risks by Status. X axis displays various Risk statuses. Data labels indicate the number of Risks associated with that status. Risk by Target Resolution Date: Column chart that displays # of Risks by year of Target Resolution Date. X axis displays Year. Data labels indicate the number of Risks associated with that category. Grid: Displays Risk details such as Investment ID, Investment Name, Investment Manager, Risk ID, Risk Name, Owner, Status, Priority and Target Resolution Date. You can further narrow your search by OBS Type, OBS Path and Target Resolution Date range.
 -
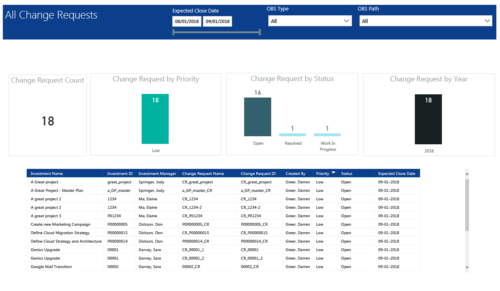 All Change Requests report provides project managers a single place to view KPIs related to Change Requests. All the KPIs are depicted in various visualizations. Change Request Count: Scorecard that displays the # of Change Requests for the selected criteria. Change Request by Priority: Column chart that displays # of Change Request by Priority. X axis displays various Change Request priority. Data labels indicate the number of Change Request associated with that category. Change Request Status: Column chart that displays # of Change Request by Status. X axis displays various Status. Data labels indicate the number of Change Request associated with that Status. Grid: Displays Change Request details such as Investment ID, Investment Name, Investment Manager, Change Request ID, Change Request Name, Status, Priority and Expected Close Date. You can further narrow your search by Expected Close Date Range, OBS Type and OBS Path.
 -
 A slide deck that reviews the processes for time entry and approval of timesheets in Clarity’s Modern UX. Used for Rego’s training engagements, it covers the Time Entry process via flow chart, steps for submitting a timesheet, adjusting a returned timesheet, and adding or removing tasks from a timesheet.
 -
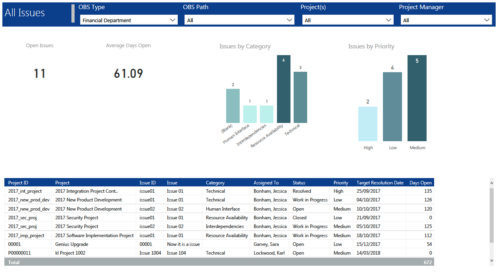 All Issues report provides project managers a single place to view KPIs related to Issues. All the KPIs are depicted in various visualizations. Open Issues: Scorecard that displays the # of Issues that are not closed or resolved. Average Days Open: Scorecard that displays the # of days on an average an issue is in open state. Issue category: Column chart that displays # of Issues by category. X axis displays various Issue categories. Data labels indicate the number of Issues associated with that category. Issue Priority: Column chart that displays # of Issues by priority. X axis displays various Issue priority. Data labels indicate the number of Issues associated with that priority. Grid: Displays Issue details such as Project ID, Project, Issue ID, Issue, Category, Assigned To, Status, Priority, Target Resolution Date and Days Open. You can further narrow your search by OBS Type, OBS Path, Project(s) and Project Manager.
 -
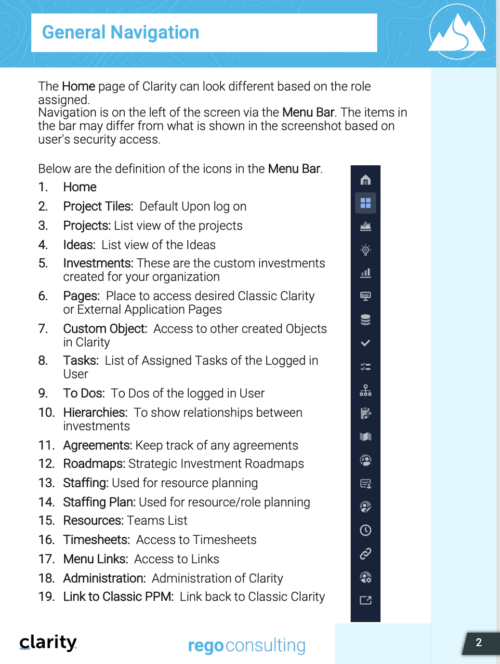
 This training document is a Rego Consulting Quick Reference Guide to assist with General Navigation in Clarity’s Modern User Experience. This doc references version 16.0 views. Doc reviews the Menu Bar and User Tool Bar.
 -
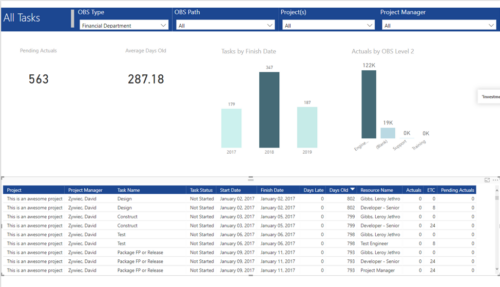 All Tasks report provides project managers a single place to view KPIs related to Tasks. All the KPIs are depicted in various visualizations. Pending Actuals: Scorecard that displays the # of Actuals that are still open and not yet posted. Average Days Old: Scorecard that displays the average number of Task Days Old. Days Old is the difference between Task Finish date and Today’s Date (when Today’s Date > Task Finish date. In other cases, it is zero) Tasks by Finish Date: Column chart that displays # of Tasks by Year of Finish date. X axis display Calendar years. Data labels indicate the number of Tasks finish date within that year. Actuals by OBS level 2: Column chart that displays sum of Task Actuals by OBS level 2. X axis display OBS level2. Data labels indicate the Actuals within that OBS level2. Grid: Displays Risk details such as Project Name, Project Manager, Task Name, Task Status, Start Date, Finish Date, Days Late, Days Old, Actuals, ETC and Pending Actuals Days Late is the difference between Task Finish date and Baseline Finish Date (when Baseline Finish Date > Task Finish date. In other cases, it is zero) You can further narrow your search by OBS Type, OBS Path, Project(s) and Project Manager.
 -
 A slide deck used in Rego’s training classed for Project Management in the Modern User Experience. Reviews terms and definitions, the OBS, Work Breakdown Structure, Templates, Roles and Responsibilities, Allocation vs ETC, Accessing Projects, Project Creation, Staffing, Tasks, Assignments, To Dos, Project Financials, and more.


Copyright 2023 • Rego Consulting Corporation • Privacy Policy