-
 The Capacity Graph portlet displays Availability, Allocations, Actuals and Assignments for a Clarity user in a single view. This portlet pulls data from timeslices, and allows the user to filter on a weekly, monthly or quarterly data. The Estimated Time to Complete (ETC) and Allocation data will only show for projects that are active. This portlet provides a Clarity user with a simple way to analyse their: Allocations vs. Availability, Allocations vs. Actuals, Allocations vs. ETC and ETC vs. Availability. The graph allows the user to determine where areas of improvement may exist and quickly identify potential areas of constraint.
 -
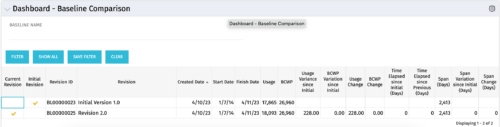 The Dashboard: Baseline Comparison portlet compares multiple baselines on a single project. The portlet is added to the dashboard page of a project and will pull in both baselines for that project and perform a comparison between the two. This portlet provides a quick way for project managers to view the differences between their baselines, especially if they have multiple members updating the project.
 -
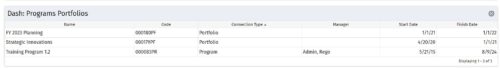 The Dashboard: Programs Portfolios portlet is placed on the dashboard page of a project. This portlet will show any programs or portfolios the project is a subproject of. The portlet will display the name, code, connection type, manager, and start/finish dates.
 -
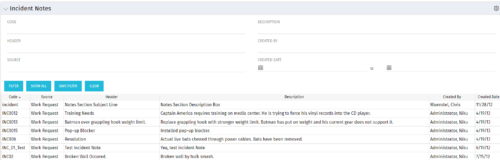 The Incident Notes portlet displays all of the notes that have been entered against Incidents in a single view. This allows users to more efficiently look at the notes, regardless of security rights, without having to enter each incident individually to view them.
 -
The Incident Notes portlet displays all of the notes that have been entered against Incidents in a single view. This allows users to more efficiently look at the notes, regardless of security rights, without having to enter each incident individually to view them.
-
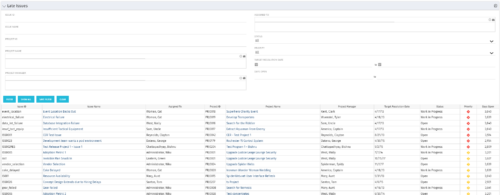 The Late Issues portlet displays all issues related to active projects that the logged in user has view rights to. The issues displayed are those that are past their target resolution date but not Closed or Resolved. The portlet provides a Project Manager the ability to view and track issues across multiple projects without going into each project individually. This portlet displays the issue, the associated project name and project manager, as well as the issue owner, target resolution date, status, and priority of the issue, along with the total number of days the issue has been open. The user has the ability to filter by several criteria in order to narrow down the late issues.
 -
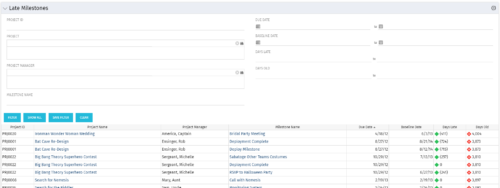 The Late Milestones portlet displays all action items related to active projects that the logged in user has view rights to. The milestones displayed are those that are not closed but are past their finish date or past their baseline finish date. The portlet provides a Project Manager the ability to view and track action items across multiple projects without going into each project individually. This portlet provides a single consolidated view of late milestones based on the current project baseline, and the age of the milestone. The portlet will display the Project ID, Project Name, Project Manager, Milestone Name, Due Date, Baseline Date, Days Late (calculated from baseline dates), and Days Old (calculated from today’s date).
 -
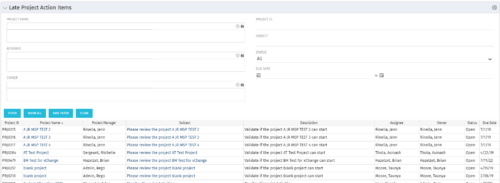 The Late Project Action Items portlet displays all action items related to active projects that the logged in user has view rights to. The action items displayed are those that are past their due date with a status of “In Progress” or “Open”. The portlet provides a Project Manager the ability to view and track action items across multiple projects without going into each project individually. In a single consolidated list, all late project action items can be easily viewed, along with the project with which they are associated, the individual assigned, and the owner of the action item.
 -
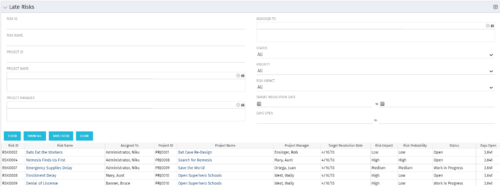 The Late Risks portlet displays all risks related to active projects that the logged in user has view rights to. The risks displayed are those that are past their target resolution date but not Closed or Resolved. The portlet provides a Project Manager the ability to view and track Risks across multiple projects without going into each project individually. This portlet displays the risk, the associated project name and project manager, as well as the risk owner, target resolution date, status, priority of the risk, and the total number of days the risk has been open.
 -
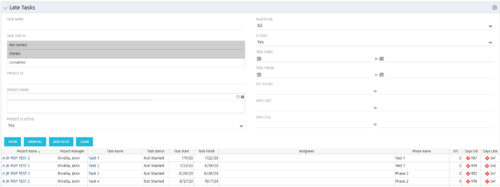 The Late Tasks portlet provides a Project Manager the ability to view and track tasks across multiple projects with due dates in the past. This portlet provides a single consolidated view of late tasks, their task start and finish date, and ETCs remaining for the task. Also displayed is the number of days that the Task Finish Date is different from the current baseline finish date (Days Late) as well as the number of days that have passed beyond the task finish date and the current date (Days Old). The user will see all tasks associated with the projects to which they have access.
 -
The Late Tasks portlet provides a Project Manager the ability to view and track tasks across multiple projects with due dates in the past. This portlet provides a single consolidated view of late tasks, their task start and finish date, and ETCs remaining for the task. Also displayed is the number of days that the Task Finish Date is different from the current baseline finish date (Days Late) as well as the number of days that have passed beyond the task finish date and the current date (Days Old). The user will see all tasks associated with the projects to which they have access.
-
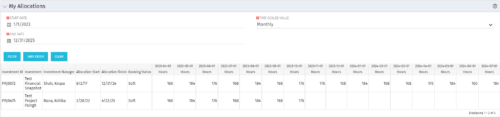 The My Allocations portlet will display the allocations for the logged in user - pulling data from the timeslices. It is used as a quick reference for the users to view their allocations across all of the projects where their allocation is greater than 0 for the specified date range the user wants. This will display both active and inactive projects.


Copyright 2023 • Rego Consulting Corporation • Privacy Policy