-
 Course Description: In the new bimodal IT environment, does your organization lack insights into what Agile work is being done and what value is being delivered? Learn how Apptio Agile Insights merges data from multiple Agile tools, including Clarity PPM, to bring together a total picture of the value IT is delivering.
 -
 Course Description: Do you want to improve the success of your projects? This class will discuss some lessons learned on making projects more successful. We will discuss things like: • Developing robust test plans, creating effective use and test cases, and implementing test scripts that make sense.
- Why failures occur and what you can do to minimize the impact and plan for success—including a case study on lessons learned.
- Developing, testing, fine-tuning, and executing deployment plans for success.
-
 Course Description: Do you want to talk to other customers that are using or plan to use project management? In this moderated round table, customers can share experiences and provide insights on process, configurations, challenges, and successes. We will divide into small groups and discuss customer selected topics—100% sharing
 -
 The Re-Baseline via Change Request process is a simple method for a member of the project (who has the ability to create change requests) to request a re-baseline of the project without the project manager having to perform it. First, the user must create the change request. The user must then start the process within the change request by using the Processes tab. Once started, the process will route an action item to the Project Manager. If rejected, the process will end and the user must start it again (if needed). If approved, the process will then baseline the project and close out the change request.
 -
 The Convert Incident to Task workflow process allows users to quickly create tasks from incidents without the need to input the information twice. It utilizes a newly added checkbox and project fields on the incident object. The user will need to select the project that he or she wants the task added to using the “Project” field on the incident object. Next, the “Convert to Task” checkbox will kick off the process. Once ticked, the process will perform the necessary actions to create a task on the specified project.
 -
 The Convert Incident to Task workflow process allows users to quickly create tasks from incidents without the need to input the information twice. It utilizes a newly added checkbox and project fields on the incident object. The user will need to select the project that he or she wants the task added to using the “Project” field on the incident object. Next, the “Convert to Task” checkbox will kick off the process. Once ticked, the process will perform the necessary actions to create a task on the specified project.
 -
 The Convert Incident to Task workflow process allows users to quickly create tasks from incidents without the need to input the information twice. It utilizes a newly added checkbox and project fields on the incident object. The user will need to select the project that he or she wants the task added to using the “Project” field on the incident object. Next, the “Convert to Task” checkbox will kick off the process. Once ticked, the process will perform the necessary actions to create a task on the specified project.
 -
 The Grant Project Edit Rights workflow process allows a project manager to grant project edit rights to another user without contacting an administrator. The workflow uses the Out-of-the-box field for Business Owner. The script starts when the field is updated. It will assign project edit rights to whichever user is added to the Business Owner field. This process can be modified to grant project edit rights to any user within a project field.
 -
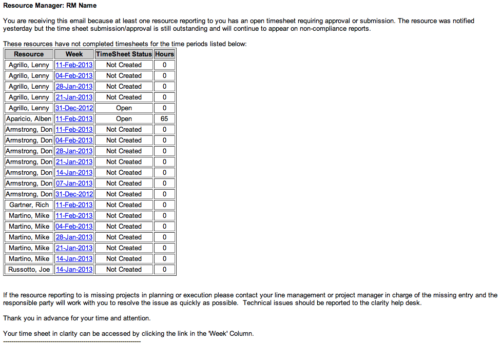 The Time Tracking Stalker - RM workflow process automatically sends an email to Resource Managers for each one of their resources that have not submitted their timesheet for a prior open time period, thus informing the RM if their resources are submitting their timesheets on time. Project Managers will also benefit since the notifications will help to ensure that time is being posted against their projects in a timely manner, helping to provide them with an accurate view of time expended on the projects.

