
- 1-33 – Green
- 34-66 – Yellow
- 67-100 – Red
-
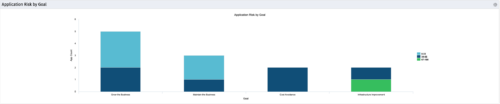 The Application Risk by Goal portlet displays a count of active applications by goal with a sub-count by risk. The graph is color-coded by risk rating:
 -
The Application Risk by Goal portlet displays a count of active applications by goal with a sub-count by risk. The graph is color-coded by risk rating:
- 1-33 – Green
- 34-66 – Yellow
- 67-100 – Red
-
 The Application Cost by Year portlet displays the active application cost by year, summarized by goal. The application cost is pulled from the application's planned cost and is displayed by year, with colors representing each application goal. This portlet provides management with a quick overview of all application costs without having to navigate to each application individually.
 -
The Application Cost by Year portlet displays the active application cost by year, summarized by goal. The application cost is pulled from the application's planned cost and is displayed by year, with colors representing each application goal. This portlet provides management with a quick overview of all application costs without having to navigate to each application individually.
-
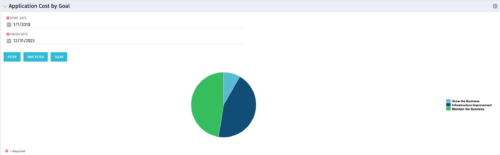 The Application Cost by Goal portlet displays the planned cost of all active applications within a user-defined timeframe, summarized by goal in a pie chart. This portlet provides management with a quick overview of cost by goal within a year without navigating to each application individually.
 -
The Application Cost by Goal portlet displays the planned cost of all active applications within a user-defined timeframe, summarized by goal in a pie chart. This portlet provides management with a quick overview of cost by goal within a year without navigating to each application individually.
-
 Course Description: Do you know what PPM, APM, Agile, ITFM, and other tools are available in the marketplace? Have you taken a strategic look at the key IT processes and tools that exist to support them? Have you been asked to evaluate and recommend a PPM tool? This class will review other ITBM tools and examine their pros and cons. We will also provide six keys to evaluating a PPM solution.
 -
 Course Description: Does your organization struggle to understand your fully burdened TCO for the applications that enable your business? Do you use spreadsheets and disparate data sources to manually calculate TCO? This session explores the data sources needed to calculate the fully burdened TCO for applications. We will also cover marketplace tools that allow you to track spending, providing trends of applications broken down by run and development costs.
 -
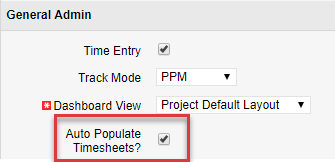
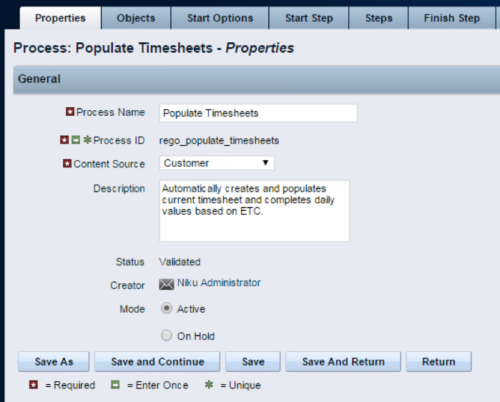 The Populate Timesheets process converts task level ETC into time entered on the timesheet. The process relies on the resource “opting in” to the process by checking a new attribute called “Auto Populate Timesheet?”, as well as the project manager “opting in” at the project level via a new attribute called “Auto Populate Timesheet?” Once the resource opts in and the PM opts in, the process will create a timesheet for the resource, pulling in the ETCs for the tasks that week and moving them to the actual hours. Once the process runs, an email will be sent to the resource letting them know the hours have been applied.
 -
 An HTML portlet that displays two buttons that link the user instantly to an object create page. The portlet comes with two buttons and the buttons can be modified to link to any creation page. Administrator can choose: Project, Idea, Application, Program, etc.
 -
 This portlet pulls back the Availability and Allocation totals by Role between a user-specified Start and Finish Date, then the user can drilldown to look at the information for Applications. The Time Period filter allows for comparing these values across different timeframes (monthly, weekly, quarterly, annual) as desired. Other filters allow for looking at Active or Inactive Roles (or both) and including Active or Inactive Projects (or both) in the totals.
 -
The Application Risk by Goal portlet displays a count of active applications by goal with a sub-count by risk. The graph is color-coded by risk rating:
- 1-33 – Green
- 34-66 – Yellow
- 67-100 – Red
