-
 Have you looked in the regoXchange or reviewed Rego’s innovation offerings? This class will show you the power of Rego’s pre-built content library, integrations, and other assets. See example after example of portlets, processes, and materials you can use to add value to your instance of Clarity. Learn how you can introduce email-based approvals with Rego's action item responder. Get a peek at Rego's new MSP integration that avoids the issues faced with the OOTB integration. Finally, understand Rego's pre-built connectors and how they can benefit your instance. Including blueprint migrator. Include free tools like GEL builder, query, XOGbridge.
 -
 “Resources with No Basic Matrix Entry” portlet displays combinations of project and resource where the assigned resource does or does not have a rate established for that project. Portlet is filterable by Projects, Project ID, Resources, and Missing Rate (Yes, No, All). How does this work? The Rate Matrix Extraction job populates a record into the NBI_PROJ_RES_RATES_AND_COSTS table for every resource/project combination that meets any of the rate matrix criteria. This portlet checks that table, and sets the Missing Rate attribu
 -
 The Investment Resource Rate portlet allows a user to search for effective (or missing) rates for resources across all investment types. It pulls rate information from the matrix extraction tables and includes currency conversion if the environment supports multiple currencies. The portlet can be used both to search for the rate of any given resource and to determine which resources might be missing rates when an error is generated when attempting to populate a cost plan (REVMGR-20728:Rates and Costs are both missing for one or more roles/resources).
 -
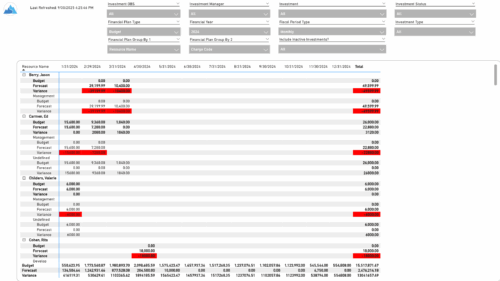
 The Financial Budget vs. Forecast by Period Detail report provides a detailed breakdown of planned or budgeted costs compared to forecasted costs by investment. It displays variances for each period and in total. Users can filter or drill down to view the specific investments that contribute to selected financial plan groupings.
 -
 The Financial Budget vs. Forecast by Period report provides insight into financial performance by comparing planned or budgeted costs against forecasted costs across defined time periods. It highlights period-level and total variances to help identify trends and deviations. Results can be grouped by up to two financial attributes, such as Charge Code, Cost Type, Department, Input Type, Location, Resource, Resource Class, Role, Transaction Class, or User Values 1 and 2, allowing flexible analysis by key dimensions.
 -
 Value Stream Management (VSM) isn’t just another buzzword; it’s the visibility layer your digital transformation is starving for. In this session, learn how to map, measure, and maximize value across the entire delivery lifecycle.
 -
 This training document is a Rego Consulting Quick Reference Guide to assist with the management of project Financials in Clarity’s Modern User Experience. This doc references version 16.1.2 views. Document includes summary information on the Financials module and provides detail on how to customize the grid and save views. Instructions are provided on how to filter data and how to use the ⋮ (vertical ellipses) icon to access further features. Detail is provided on the group by function, the column panel, the export of cost plan and editing cost plan and budget plan data from the grid.
 -
 Many organizations want to transition to a more product-centric delivery model but struggle with how to get started. This session discusses key success factors of Broadcom’s own project-to-product transition with an aim to resolve issues facing your organization.
 -
 Uncover the advantages of shifting from showback to chargeback and learn how to successfully execute chargeback within your organization. In this session, we will delve into chargeback processes, focusing on industry best practices and offering expert guidance on designing and implementing effective chargeback strategies. Additionally, we will explore the utilization of the Bill of IT as a powerful tool to reinforce your chargeback approach.
 -
 Learn about the various techniques and emerging methods companies are taking to capitalize Agile work. You'll learn how some companies are moving away from timesheets and using models based on story points and team rates to generate capitalization reporting.
 -
 This configuration and accompanying process allows users to capture Financial and Non-Financial (Metrics, Soft, etc.) Benefit in a custom sub-object, then programmatically create an out-of-the-box Benefit Plan with just the Financial Portion from the custom sub-object. The solution is comprised of:
- Sub-Object (Benefit Plan Details, Parent = Project)
- Process: Create Benefit Plan (uses sub-object as primary input, native BP is output)
- Process: Update sql - Cost Benefit Plans (one-time script to update Projects)
- Ensure on the Benefit Details List view the Planned and Realized Amounts are displayed
- Modifying the Create Benefit Plan Process in support of a BP naming convention consistent with local PMO Practices
- Modifying the Create Benefit Plan Process to link the BP to the Cost Plan of Record
- Creating a Portlet that pulls together rows of data from the sub-object across multiple projects in a summarized view as well as a detailed view
-

- ITFM Introduction
- PMO & IT Finance Collaboration
- Where ITFM and PPM Meet
- Connecting PPM with ITFM


Copyright 2023 • Rego Consulting Corporation • Privacy Policy