-
 The Hours and Cost by Vendor - Graph portlet displays vendor hour or costs by month. Using this portlet, management is provided with a graphical representation of vendor costs or hours by month for a set of time without running a report or navigating to each resource individually. This portlet uses the monthly actual timeslices. Additionally, the user must select a date range and whether to display hours or costs. Once populated, the graph will display all vendors that currently have hours and cost for the selected date range.
 -
 Aligning work to organizational strategy is a fundamental requirement in today's ever-changing marketplace. High performing organizations are moving beyond basic connections to introduce strategic hierarchies that are tied to real measurements of business value via Clarity's Objectives and Key Results (OKRs). Join our expert guides as they present key concepts, best practices, and the evolution of strategic alignment.
 -
 This Portlet produces a Grid View of Resources using total Resource Allocation from each Project’s Team / Staff, per month; output is expressed as a %. Users can specify which Resource OBS to use as a Filter (unit and descendants is assumed) as well as a Start/End Date.
 -
This Portlet produces a Grid View of Resources using total Resource Allocation from each Project’s Team / Staff, per month; output is expressed as a %. Users can specify which Resource OBS to use as a Filter (unit and descendants is assumed) as well as a Start/End Date.
-
This Portlet produces a Grid View of Resources using total Resource Allocation from each Project’s Team / Staff, per month; output is expressed as a %. Users can specify which Resource OBS to use as a Filter (unit and descendants is assumed) as well as a Start/End Date.
-
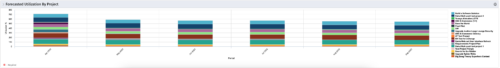 This Portlet produces a Stacked Chart of Projects using total Resource Allocation from each Project’s Team / Staff, per month. Users can specify which Resource OBS to use as a Filter (unit and descendants is assumed) as well as a Start/End Date Range.
 -
This Portlet produces a Stacked Chart of Projects using total Resource Allocation from each Project’s Team / Staff, per month. Users can specify which Resource OBS to use as a Filter (unit and descendants is assumed) as well as a Start/End Date Range.
-
 A slide deck used in Rego’s training sessions around Financials, in Clarity’s modern UX. The slides cover the Value of Financial Management, Core Financial Components, Investment Financial Attributes, the Rate Matrix, Cost/Budget/Benefit Plans, Actual Costs, Integrations, and Best Practices.
 -
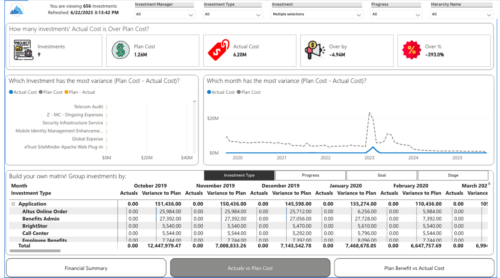
 Gain a financial view of your investments by comparing actuals to planned cost and planned benefit. Report views include:
- Financial Summary
- Planned Benefit vs Actual Cost
- Actuals vs Planned Costs
-
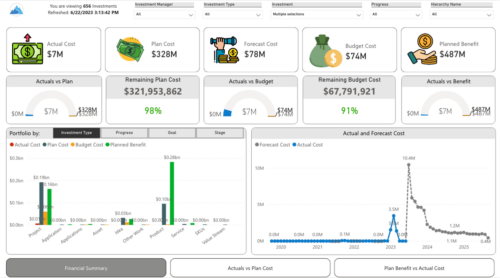
 Gain a financial view of your investments by comparing actuals to planned cost and planned benefit. Report views include: • Financial Summary • Planned Benefit vs Actual Cost • Actuals vs Planned Costs Demo Video - https://www.youtube.com/watch?v=uyDSbbgG1O8&list=PLXJ5ktuWV0jiS9CvBpHvBIwpKPmA9uvwK&index=2
 -
 The Financial Summary by Transaction Class provides a visual graph for each year’s financial picture for multiple years. Report contains the following items: KPIs: Displays total benefit, capital, expense and net cash flow for the selected filter criteria Grid: Displays year wise break up of benefit, capital, expense and net cash flow for the selected filter criteria Graph: Benefit, capital, expense and net cash flow are depicted in graphical way for multiple years. This report will show the user where they need to concentrate their efforts in order to meet financial commitments. User can further narrow their search by OBS Type & Path.
 -
 The Financial Summary by Transaction Class - Graph provides a visual graph for each years financial picture beginning with current year and going forward into the future. It will show the user where they need to concentrate their efforts in order to meet financial commitments.
 -
The Financial Summary by Transaction Class - Graph provides a visual graph for each years financial picture beginning with current year and going forward into the future. It will show the user where they need to concentrate their efforts in order to meet financial commitments.
-
The Financial Summary by Transaction Class - Graph provides a visual graph for each years financial picture beginning with current year and going forward into the future. It will show the user where they need to concentrate their efforts in order to meet financial commitments.
-
 This stacked bar graph portlet displays the financial summary by transaction class for the current and future fiscal annual periods. Filters are provided for:
- OBS
- Portfolio
-
This stacked bar graph portlet displays the financial summary by transaction class for the current and future fiscal annual periods. Filters are provided for:
- OBS
- Portfolio
-
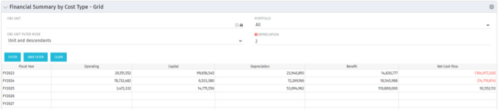 The Financial Summary by Cost Type - Grid is very beneficial as it provides actual numbers for each years financial picture beginning with current year and going forward into the future. It will show the user where they need to concentrate their efforts in order to meet financial commitments.
 -
The Financial Summary by Cost Type - Grid is very beneficial as it provides actual numbers for each years financial picture beginning with current year and going forward into the future. It will show the user where they need to concentrate their efforts in order to meet financial commitments.
-
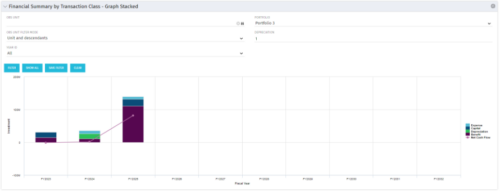
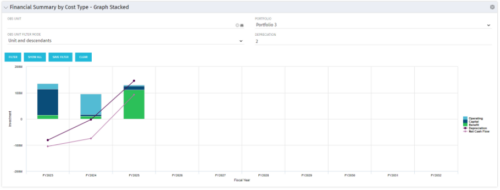 The Financial Summary by Cost Type - Graph Stacked provides a visual stacked graph for each years financial picture beginning with current year and going forward into the future. It will show the user where they need to concentrate their efforts in order to meet financial commitments.
 -
The Financial Summary by Cost Type - Graph Stacked provides a visual stacked graph for each years financial picture beginning with current year and going forward into the future. It will show the user where they need to concentrate their efforts in order to meet financial commitments.
-
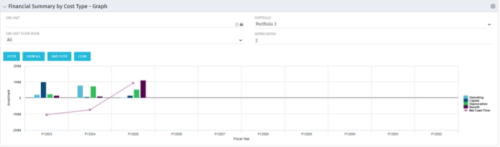 The Financial Summary by Cost Type - Graph provides a visual stacked graph for each years financial picture beginning with current year and going forward into the future. It will show the user where they need to concentrate their efforts in order to meet financial commitments.
 -
The Financial Summary by Cost Type - Graph provides a visual stacked graph for each years financial picture beginning with current year and going forward into the future. It will show the user where they need to concentrate their efforts in order to meet financial commitments.
-
The Financial Summary by Cost Type - Graph provides a visual stacked graph for each years financial picture beginning with current year and going forward into the future. It will show the user where they need to concentrate their efforts in order to meet financial commitments.
-
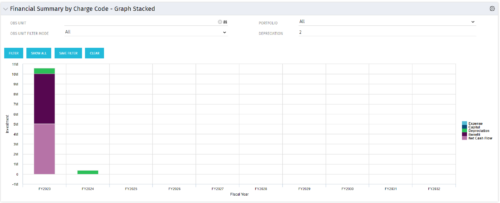 The Financial Summary by Charge Code – Graph Stacked portlet displays yearly charge code financial information across all projects in a stacked bar graph. This portlet provides management with a snapshot of all projects’ financial information totaled and sorted by expense, capital, depreciation, benefit, and net cash flow. The depreciation is calculated based on a straight-line method. The user may filter on OBS unit and/or portfolio to narrow down the search results.
 -
The Financial Summary by Charge Code – Graph Stacked portlet displays yearly charge code financial information across all projects in a stacked bar graph. This portlet provides management with a snapshot of all projects’ financial information totaled and sorted by expense, capital, depreciation, benefit, and net cash flow. The depreciation is calculated based on a straight-line method. The user may filter on OBS unit and/or portfolio to narrow down the search results.
-
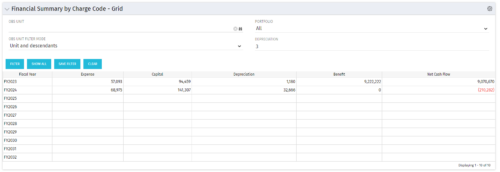 The Financial Summary by Charge Code – Grid portlet displays yearly charge code financial information across all projects. This portlet provides management with a snapshot of all projects’ financial information totaled and sorted by expense, capital, depreciation, benefit, and net cash flow. The depreciation is calculated based on a straight-line method. The user may filter on OBS unit and/or portfolio to narrow down the search results.
 -
The Financial Summary by Charge Code – Grid portlet displays yearly charge code financial information across all projects. This portlet provides management with a snapshot of all projects’ financial information totaled and sorted by expense, capital, depreciation, benefit, and net cash flow. The depreciation is calculated based on a straight-line method. The user may filter on OBS unit and/or portfolio to narrow down the search results.
-
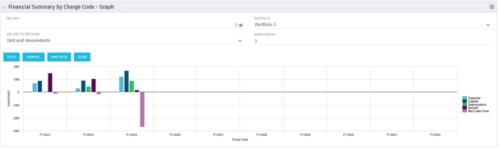 The Financial Summary by Charge Code - Graph portlet displays yearly charge code financial information across all projects in a bar graph. This portlet provides management with a snapshot of all projects’ financial information totaled and sorted by expense, capital, depreciation, benefit, and net cash flow. The depreciation is calculated based on a straight line method. The user may filter on OBS unit and/or portfolio to narrow down the search results.
 -
The Financial Summary by Charge Code - Graph portlet displays yearly charge code financial information across all projects in a bar graph. This portlet provides management with a snapshot of all projects’ financial information totaled and sorted by expense, capital, depreciation, benefit, and net cash flow. The depreciation is calculated based on a straight line method. The user may filter on OBS unit and/or portfolio to narrow down the search results.
-
 This course will focus on the financial setup and processing in Clarity. We'll discuss topics such as financial entities, fiscal periods, financial attributes, and how they all tie back to a labor rate matrix. These components are crucial for calculating labor costs within Clarity and enabling project managers to make financially sound decisions.
 -
 Do you want to talk to other customers that are using - or plan to use - Clarity's financial management capabilities? In this moderated Round Table, attendees can share experiences and provide insights on process, configurations, challenges, and successes. We will have an expert panel and then divide into small groups to discuss customer selected topics. 100% sharing, 100% learning.
 -
 Do you want to talk to other customers that are using or plan to use financial management? In this moderated Round Table where customers can share experiences and provide insights on process, configurations, challenges, and successes. We will have an expert panel and then divide into small groups and discuss customer selected topics - 100% sharing.
 -
 Course Description: Do you want to talk to other customers that are using or plan to use financial management? In this moderated round table, customers can share experiences and provide insights on process, configurations, challenges, and successes. We will divide into small groups and discuss customer selected topics—100% sharing.


Copyright 2023 • Rego Consulting Corporation • Privacy Policy