
- Trend 1: Going Beyond Strategic Alignment
- Trend 2: Pivoting Quickly
- Trend 3: Value Scrutiny for PPM
- Trend 4: Hybrid Financial Management
- Trend 5: AI has the Buzz, Predictive Analytics has the Momentum
- Trend 6: Balanced Ecosystem of Tools
- Trend 7: Collaboration
-
 A presentation slide deck from Rego University 2022. Document reviews the 7 trends that Rego is seeing in the PPM space.
 -
 This training document is a Rego Consulting Quick Reference Guide to assist with the creation of Cost Plans in Clarity’s Modern User Experience. The document reviews navigation to the Financial Module, the Cost Plan sub-page and creating the plan.
 -
 A slide deck used in Rego’s training sessions around Financials, in Clarity’s modern UX. The slides cover the Value of Financial Management, Core Financial Components, Investment Financial Attributes, the Rate Matrix, Cost/Budget/Benefit Plans, Actual Costs, Integrations, and Best Practices.
 -
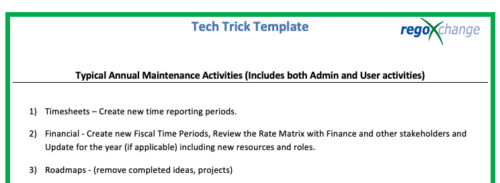 This is a list of 12 typical maintenance items that should be completed for Clarity on an annual basis. There is also a short list of items that should be completed periodically depending on client policies.
 -
 What should I expect to see within my organization related to PM over the next couple of years? How should I prepare my PMs, PMOs, or myself to embrace the new trends within the industry. This class will share Rego's observations on industry trends within PPM.
 -
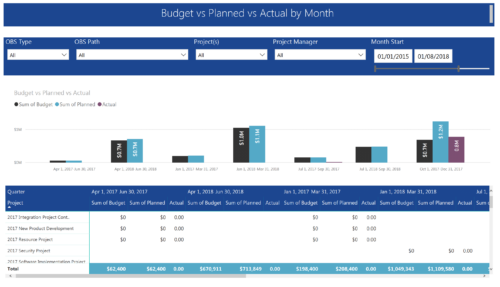 Project Budget vs Planned vs Actual by Month report provides the Project Managers a single place to view Project Budget, Planned and Actual Cost for multiple projects. This report displays Project Budget vs Planned vs Actual by Month in the form of clustered bar chart over a period of time. User can further drill down the information to investment level by selecting a particular bar within the chart. User can further narrow their search by OBS Type & Path, Project(s), Project Manager, Month Start and End Date.
 -
 Actuals & ETC by Resource Assignment report provides project managers a single place to view Actuals and ETC associated with resources across multiple Tasks and Projects. It displays the following: Actual and ETC Hours by Start Date: Stacked Column chart that displays the total Actual hours and ETC hours per month of fiscal period. Grey color indicates Actuals and Purple indicates ETC hours during that month. Grid: Displays Investment name, Task, Assigned resource ETC and Actual hours per month of fiscal period. It also displays aggregated column and row totals for Actuals and ETC hours. You can further narrow your search by OBS Type, OBS Path & Start Date range.
 -
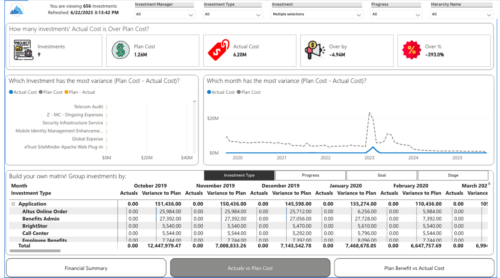
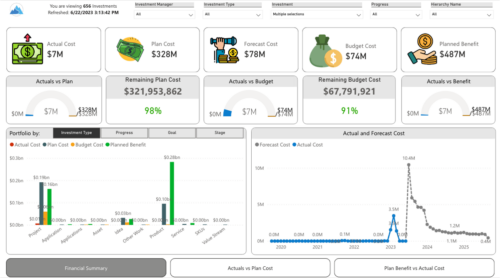 Gain a financial view of your investments by comparing actuals to planned cost and planned benefit. Report views include:
- Financial Summary
- Planned Benefit vs Actual Cost
- Actuals vs Planned Costs
