-
 Do you want to talk to other customers that are using - or plan to use - Clarity's financial management capabilities? In this moderated Round Table, attendees can share experiences and provide insights on process, configurations, challenges, and successes. We will have an expert panel and then divide into small groups to discuss customer selected topics. 100% sharing, 100% learning.
 -
 The Rego PowerBI Reporting Suite features close to 100 free PowerBI reports, designed to enhance project management and reporting capabilities.
 -
 Annual planning shouldn’t be an Excel nightmare—or disconnected from strategy. In this session, see how one organization used Strategic Portfolio Management (SPM) with Clarity to transform their budgeting process from reactive to strategic.
 -
 Value Stream Management (VSM) isn’t just another buzzword; it’s the visibility layer your digital transformation is starving for. In this session, learn how to map, measure, and maximize value across the entire delivery lifecycle.
 -
 Aligning work to organizational strategy is a fundamental requirement in today's ever-changing marketplace. High performing organizations are moving beyond basic connections to introduce strategic hierarchies that are tied to real measurements of business value via Clarity's Objectives and Key Results (OKRs). Join our expert guides as they present key concepts, best practices, and the evolution of strategic alignment.
 -
 This course will focus on the financial setup and processing in Clarity. We'll discuss topics such as financial entities, fiscal periods, financial attributes, and how they all tie back to a labor rate matrix. These components are crucial for calculating labor costs within Clarity and enabling project managers to make financially sound decisions.
 -
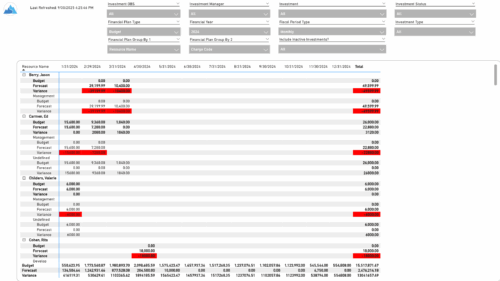 The Financial Budget vs. Forecast by Period report provides insight into financial performance by comparing planned or budgeted costs against forecasted costs across defined time periods. It highlights period-level and total variances to help identify trends and deviations. Results can be grouped by up to two financial attributes, such as Charge Code, Cost Type, Department, Input Type, Location, Resource, Resource Class, Role, Transaction Class, or User Values 1 and 2, allowing flexible analysis by key dimensions.
 -
 The Financial Budget vs. Forecast by Period Detail report provides a detailed breakdown of planned or budgeted costs compared to forecasted costs by investment. It displays variances for each period and in total. Users can filter or drill down to view the specific investments that contribute to selected financial plan groupings.
 -
 The Investment Baseline vs. Plan by Task report offers an in-depth view of how resource and role allocations align with original plans. It breaks down key metrics such as baseline, actuals, remaining effort, projected totals, and variances across a rolling 12-month period based on the selected start date. Data is presented both monthly and cumulatively for each investment and assignment, with the flexibility to view values in hours or FTEs. This report helps stakeholders assess performance, identify gaps between planned and actual work, and better understand resource utilization trends.


Copyright 2023 • Rego Consulting Corporation • Privacy Policy