-
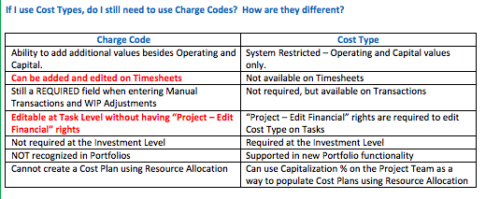 The Cost Type field was introduced in Clarity 13.3, but had some limitations because it wasn’t available in certain financial areas. The Clarity 14.3 release includes the addition of Cost Type in the Cost/Rate Matrix, Chargebacks, Transactions and WIP Adjustments. This Technical Trick assists you in moving from Charge Code to Cost Type.
 -
 This training document is a Rego Consulting Quick Reference Guide to assist with Financial Actuals and Reporting in Clarity’s Modern User Experience. This doc references version 16.0.3 views. Document includes detail on which jobs should be run to ensure project and financial data is synchronized with the latest posted actuals. Information is provided on how to analyze cost plans and how to review actual transactions. Instructions are provided on how to analyze budget plans.
 -
 This training document is a Rego Consulting Quick Reference Guide to assist with the management of Budget Plans in Clarity’s Modern User Experience. This doc references version 16.0.3 views. Doc provides detail on how to submit a cost plan for approval, how to approve or reject submitted budgets and also provides additional detail on the rules that apply to the submission of budget plans.
 -
 This training document is a Rego Consulting Quick Reference Guide to assist with transaction entry in Clarity’s Modern User Experience. The document covers transaction entry basics, creating a voucher header, entering line-item details, and entering line detail transactions.
 -
 A Quick Reference Guide to assist with submitting a Cost Plan for Approval in Clarity. Reviews the process while utilizing Clarity’s Classic UX with the Phoenix theme applied.
 -
 A Quick Reference Guide to assist with the creating and managing of Cost Plans in Clarity. The document uses screen shots from the Classic UX using the Phoenix theme.
 -
 A Quick Reference Guide to assist in the creation of Benefit Plans in Clarity’s Classic UX. Reviews the process to access and create the benefit plan, entering benefit details lines, and associating a benefit plan to a cost plan.
 -
 A quick reference card to assist in the creation of a Financial Summary for an investment.
 -
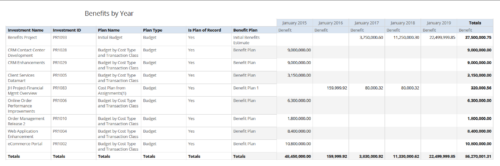 Benefits by year report provides the project manager a single place to view Benefit plan and its associated benefit for various years across multiple projects. Project Managers can use this report to analyze if the projects are giving intended benefits and take appropriate decisions accordingly. User can further narrow their search by OBS Type & Path, Investment Name, Investment Manager, Investment Type, Plan Type and Is Plan of Record?.
 -
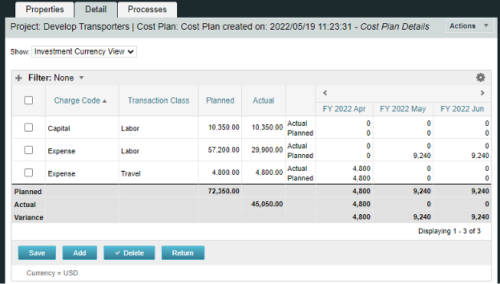
A process creating a new Cost Plan. Cost Plan properties:
Pre-conditions:Name Cost Plan created on: yyyy/mm/dd hh:mm:ss Grouping attributes Charge Code, Transaction Type Start Period The earliest fiscal period with Actuals (from PPA_WIP table) or current period, if there are no actuals Finish Period The latest fiscal period with a non-zero allocation (from PRJ_BLB_SLICES table, SLICE_REQUEST_ID = 6 Period Type Monthly Plan of Record True Planned Cost For periods in the past – from Actuals (Charge Code, Transaction Type, Quantity (Units), Cost (Amount) taken from Transactions (PPA_WIP & PPA_WIP_DETAILS); For current and future periods – from Allocations (Charge Code taken from the Project, Transaction Class from the Resource, Quantity from allocation slices, Cost from the Rate Matrix (NBI_PROJ_RES_RATES_AND_COSTS table) - the Project must be financially enabled.
- if a new Team Member is added, Rate Matrix job must be run, so the rates are populated in the NBI table.
- if the Allocation changes, allow the timeslice job to finish before running the process.
- the Project should have the Charge Code set.
-
 Do you want to report on TCO for your organization by business function, application, or service? This should be the financial management goal of every organization. This class will discuss a path and some architecture choices to make this a reality. We will highlight want some customers are doing today and share some best practices on the journey.
 -
 This Portlet produces a Grid View of Resources using total Resource Allocation from each Project’s Team / Staff, per month; output is expressed as a %. Users can specify which Resource OBS to use as a Filter (unit and descendants is assumed) as well as a Start/End Date.


Copyright 2023 • Rego Consulting Corporation • Privacy Policy