-
 Part of the Business Transformation collection, this portlet displays count of the planned benefits (savings) per project manager. It also displays if any of the planned benefits are Critical/ At Risk / On Track, along with the total planned benefit amount.
 -
Part of the Business Transformation collection, this portlet displays count of the planned benefits (savings) per project manager. It also displays if any of the planned benefits are Critical/ At Risk / On Track, along with the total planned benefit amount.
-
 Part of the Business Transformations collection, this portlet displays planned revenue as defined by a project whose goal is "Grow the business". It uses the Planned Revenue Query as a data provider. This portlet provides a holistic overview of how many projects following the goal “Grow the Business” are Critical/ At Risk / On Track with regard to the planned revenue.
 -
Part of the Business Transformations collection, this portlet displays planned revenue as defined by a project whose goal is "Grow the business". It uses the Planned Revenue Query as a data provider. This portlet provides a holistic overview of how many projects following the goal “Grow the Business” are Critical/ At Risk / On Track with regard to the planned revenue.
-
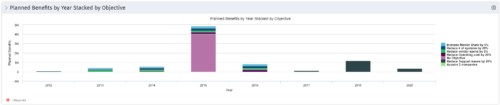 This Portlet starts by pulling Active Investments from a Classic UI Portfolio. It then looks for the Cost Plan of Record and its’ linked Benefit Plan. It then aggregates the Planned Benefit and groups it by Objective, then presents a stacked bar chart.
 -
This Portlet starts by pulling Active Investments from a Classic UI Portfolio. It then looks for the Cost Plan of Record and its’ linked Benefit Plan. It then aggregates the Planned Benefit and groups it by Objective, then presents a stacked bar chart.
-
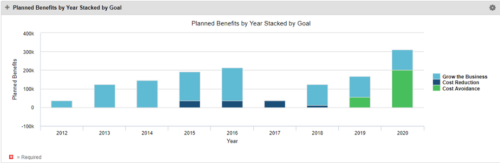 This Portlet starts by pulling Active Investments from a Classic UI Portfolio. It then looks for the Cost Plan of Record and its’ linked Benefit Plan. It then aggregates the Planned Benefit and groups it by Goal, then presents a stacked bar chart.
 -
This Portlet starts by pulling Active Investments from a Classic UI Portfolio. It then looks for the Cost Plan of Record and its’ linked Benefit Plan. It then aggregates the Planned Benefit and groups it by Goal, then presents a stacked bar chart.
-
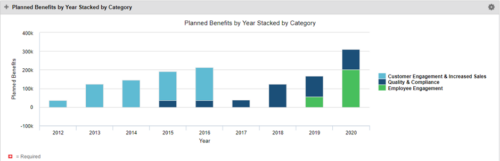 This Portlet starts by pulling Active Investments from a Classic UI Portfolio. It then looks for the Cost Plan of Record and its’ linked Benefit Plan. It then aggregates the Planned Benefit and groups it by Category, then presents a stacked bar chart.
 -
This Portlet starts by pulling Active Investments from a Classic UI Portfolio. It then looks for the Cost Plan of Record and its’ linked Benefit Plan. It then aggregates the Planned Benefit and groups it by Category, then presents a stacked bar chart.
-
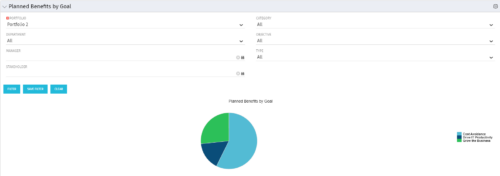 Part of the Business Transformation Package, this pie chart portlet shows planned benefits across the system grouped by Goal. The data is displayed form the investments in a portfolio. The portlet lets the Portfolio Manager know on which GOAL the planned benefit is allocated, so as to target the overall investment spread in the portfolio.


Copyright 2023 • Rego Consulting Corporation • Privacy Policy