-
 Course Description: Does your IT organization struggle with IT budgeting and annual planning? Does your annual budget and planning process take months? This session explores leading approaches and purpose-built tools to shorten your budget cycle, align resources to business needs, and plan resources into future years while reducing errors and manual effort.
 -
 A presentation slide deck from Rego University 2022. This course was a review of the power of perception and how to improve on the adoption of Apptio.
- The Perception of Apptio
- The Perception of Adoption
- Driving Adoption
- Measuring Success
-
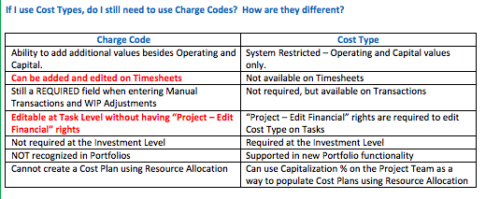 The Cost Type field was introduced in CA PPM 13.3, but had some limitations because it wasn’t available in certain financial areas. The CA PPM 14.3 release includes the addition of Cost Type in the Cost/Rate Matrix, Chargebacks, Transactions and WIP Adjustments. This Technical Trick assists you in moving from Charge Code to Cost Type.
 -
 Many organizations want to transition to a more product-centric delivery model but struggle with how to get started. This session discusses key success factors of Broadcom’s own project-to-product transition with an aim to resolve issues facing your organization.
 -
 Apptio can be used for so much more than App TCO and Service Costing. Let's talk about valuable non-traditional use cases you might want to consider exploring.
 -
 A review of how Northern Trust integrates financial systems with Clarity PPM bilaterally, providing the Finance organization crucial information, and NT Project Managers with a birds-eye view of project financials. Utilizing the Rego Data Extractor and the Rego Data Processor, these information exchanges help Portfolio and Project Managers eliminate their manual and redundant efforts, solidify their overall data accuracy, and dramatically improve the content provided to their Execs for decision-making.
 -
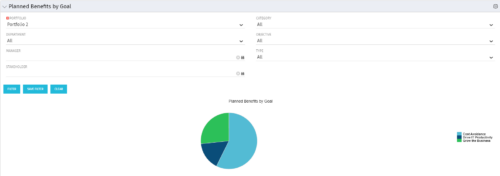 Part of the Business Transformation Package, this pie chart portlet shows planned benefits across the system grouped by Goal. The data is displayed form the investments in a portfolio. The portlet lets the Portfolio Manager know on which GOAL the planned benefit is allocated, so as to target the overall investment spread in the portfolio.
 -
Part of the Business Transformation Package, this pie chart portlet shows planned benefits across the system grouped by Goal. The data is displayed form the investments in a portfolio. The portlet lets the Portfolio Manager know on which GOAL the planned benefit is allocated, so as to target the overall investment spread in the portfolio.
-
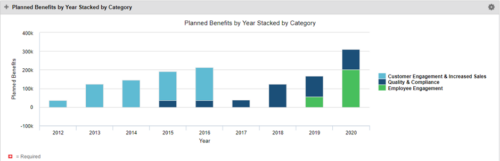 This Portlet starts by pulling Active Investments from a Classic UI Portfolio. It then looks for the Cost Plan of Record and its’ linked Benefit Plan. It then aggregates the Planned Benefit and groups it by Category, then presents a stacked bar chart.
 -
This Portlet starts by pulling Active Investments from a Classic UI Portfolio. It then looks for the Cost Plan of Record and its’ linked Benefit Plan. It then aggregates the Planned Benefit and groups it by Category, then presents a stacked bar chart.


Copyright 2023 • Rego Consulting Corporation • Privacy Policy