
A process creating a new Cost Plan.
Cost Plan properties:
|
-
-
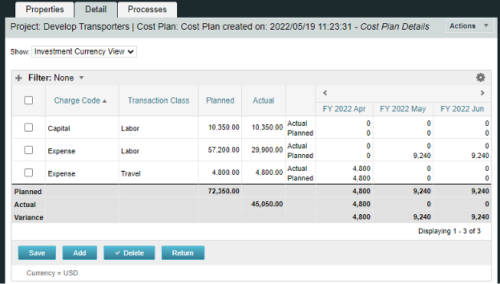
A process creating a new Cost Plan. Cost Plan properties:
Pre-conditions:Name Cost Plan created on: yyyy/mm/dd hh:mm:ss Grouping attributes Charge Code, Transaction Type Start Period The earliest fiscal period with Actuals (from PPA_WIP table) or current period, if there are no actuals Finish Period The latest fiscal period with a non-zero allocation (from PRJ_BLB_SLICES table, SLICE_REQUEST_ID = 6 Period Type Monthly Plan of Record True Planned Cost For periods in the past – from Actuals (Charge Code, Transaction Type, Quantity (Units), Cost (Amount) taken from Transactions (PPA_WIP & PPA_WIP_DETAILS); For current and future periods – from Allocations (Charge Code taken from the Project, Transaction Class from the Resource, Quantity from allocation slices, Cost from the Rate Matrix (NBI_PROJ_RES_RATES_AND_COSTS table) - the Project must be financially enabled.
- if a new Team Member is added, Rate Matrix job must be run, so the rates are populated in the NBI table.
- if the Allocation changes, allow the timeslice job to finish before running the process.
- the Project should have the Charge Code set.
-
 Course description: “How does my financial forecast and budget (project/program/portfolio) relate to the department/cost center budgets that finance prepares? Is there a better way to link the two together? This is a topic many organizations struggle with, and this session will review tools and processes that can help solve this problem.”
 -
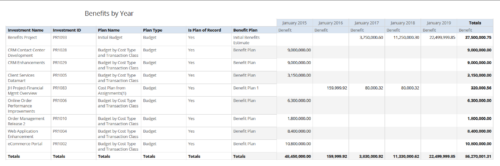 Benefits by year report provides the project manager a single place to view Benefit plan and its associated benefit for various years across multiple projects. Project Managers can use this report to analyze if the projects are giving intended benefits and take appropriate decisions accordingly. User can further narrow their search by OBS Type & Path, Investment Name, Investment Manager, Investment Type, Plan Type and Is Plan of Record?.
 -
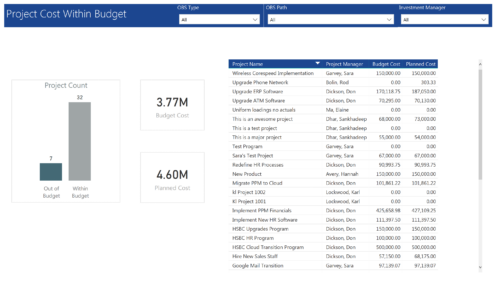 Project Cost within Budget report displays count of projects that are within or exceeding budget in the form of a bar chart. It also displays Total budget cost and Planned cost. User can further drill down the details to investment level. You can further narrow your search by OBS Type & Path and Investment Manager.
 -
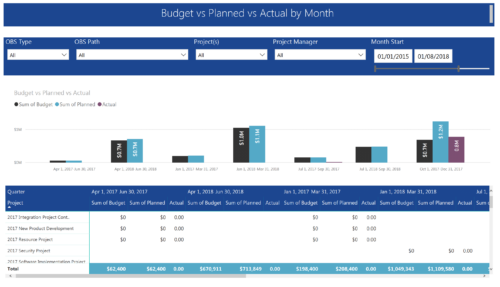 Project Budget vs Planned vs Actual by Month report provides the Project Managers a single place to view Project Budget, Planned and Actual Cost for multiple projects. This report displays Project Budget vs Planned vs Actual by Month in the form of clustered bar chart over a period of time. User can further drill down the information to investment level by selecting a particular bar within the chart. User can further narrow their search by OBS Type & Path, Project(s), Project Manager, Month Start and End Date.
 -
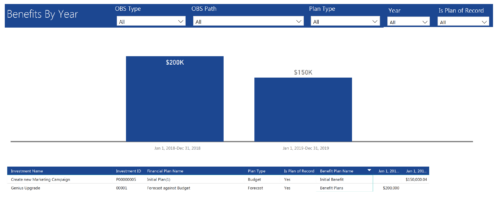 Benefits by year report provide the project manager a single place to view Benefit plan (Forecast /Budgeted) and its associated benefit for various years across multiple projects. Information is displayed in a bar graph and user can further drill down the details to investment level. Project Managers can use this report to analyze if the projects are giving intended benefits and take appropriate decisions accordingly. User can further narrow their search by OBS Type & Path, Plan Type (Budget/Forecast), Year and Is Plan of Record?.
 -
 Actuals & ETC by Resource Assignment report provides project managers a single place to view Actuals and ETC associated with resources across multiple Tasks and Projects. It displays the following: Actual and ETC Hours by Start Date: Stacked Column chart that displays the total Actual hours and ETC hours per month of fiscal period. Grey color indicates Actuals and Purple indicates ETC hours during that month. Grid: Displays Investment name, Task, Assigned resource ETC and Actual hours per month of fiscal period. It also displays aggregated column and row totals for Actuals and ETC hours. You can further narrow your search by OBS Type, OBS Path & Start Date range.
 -
 Many times Roles are spread out geographically or by function and these Roles will have different rates. For example, a developer in India may charge $25/hour vs a Developer in US may charge $50/hour. When the project team has a requirement of several developers, the PM will have to add a region specific role (Developer-US, Developer-India) so that the right rates can be applied when a cost plan is created. This creates a challenge in terms of Resource Management. As the Demand and Capacity can be spread between different region specific roles. Proper configuration on the Rate Matrix can allow you to have one Role name but different rates based on Location or Department. This allows greater flexibility and takes away the redundancy of Role Names. You can do so with the Project Team Member Properties.
 -

The Transaction Adapter – is a text based CSV file which automates the importing of monthly non labor financial data into Clarity directly from your financial system. This integration eliminates the need to create non-labor transactions manually in Clarity and will provide more accurate project, program, and portfolio financial reporting. -
 A quick reference card to assist in the creation of a Financial Summary for an investment.
