
- Financial Summary
- Planned Benefit vs Actual Cost
- Actuals vs Planned Costs
-
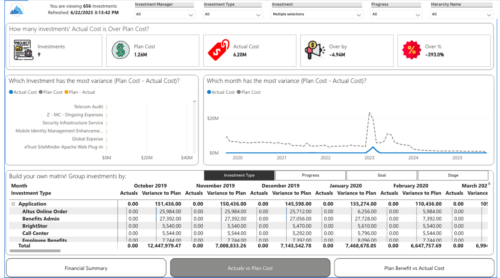
 Gain a financial view of your investments by comparing actuals to planned cost and planned benefit. Report views include:
 -
 Actuals & ETC by Resource Assignment report provides project managers a single place to view Actuals and ETC associated with resources across multiple Tasks and Projects. It displays the following: Actual and ETC Hours by Start Date: Stacked Column chart that displays the total Actual hours and ETC hours per month of fiscal period. Grey color indicates Actuals and Purple indicates ETC hours during that month. Grid: Displays Investment name, Task, Assigned resource ETC and Actual hours per month of fiscal period. It also displays aggregated column and row totals for Actuals and ETC hours. You can further narrow your search by OBS Type, OBS Path & Start Date range.
 -
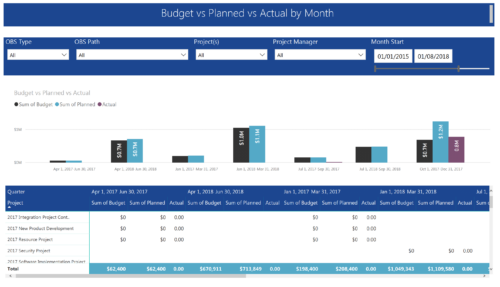 Project Budget vs Planned vs Actual by Month report provides the Project Managers a single place to view Project Budget, Planned and Actual Cost for multiple projects. This report displays Project Budget vs Planned vs Actual by Month in the form of clustered bar chart over a period of time. User can further drill down the information to investment level by selecting a particular bar within the chart. User can further narrow their search by OBS Type & Path, Project(s), Project Manager, Month Start and End Date.
 -
 What should I expect to see within my organization related to PM over the next couple of years? How should I prepare my PMs, PMOs, or myself to embrace the new trends within the industry. This class will share Rego's observations on industry trends within PPM.
 -
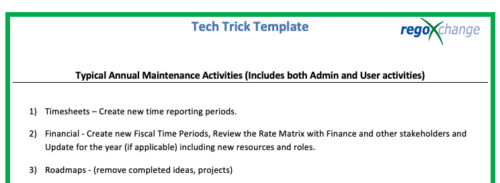 This is a list of 12 typical maintenance items that should be completed for Clarity on an annual basis. There is also a short list of items that should be completed periodically depending on client policies.
 -
 A slide deck used in Rego’s training sessions around Financials, in Clarity’s modern UX. The slides cover the Value of Financial Management, Core Financial Components, Investment Financial Attributes, the Rate Matrix, Cost/Budget/Benefit Plans, Actual Costs, Integrations, and Best Practices.
 -
 This training document is a Rego Consulting Quick Reference Guide to assist with the creation of Cost Plans in Clarity’s Modern User Experience. The document reviews navigation to the Financial Module, the Cost Plan sub-page and creating the plan.
 -
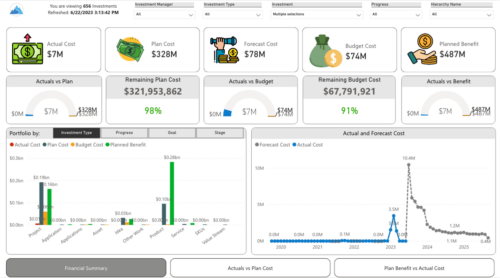
 Gain a financial view of your investments by comparing actuals to planned cost and planned benefit. Report views include: • Financial Summary • Planned Benefit vs Actual Cost • Actuals vs Planned Costs Demo Video - https://www.youtube.com/watch?v=uyDSbbgG1O8&list=PLXJ5ktuWV0jiS9CvBpHvBIwpKPmA9uvwK&index=2
 -
 This asset in used to update investment level TSV attributes using Cost Plan, Budget plan, Actual transaction, Planned and Budgeted Benefit Cost data as needed. It uses mappings/logic from ‘Cost Rollup Mappings’ object. Compatibility – Its compatible from 16.0 onwards with Oracle, PostgreSQL and MSSQL.
 -
 This training document is a Rego Consulting Quick Reference Guide to assist with the process of creating financial actuals and the supporting reports in Clarity’s Modern User Experience. The document covers running jobs to sync data, analyzing cost plans, reviewing transactions, and analyzing cost and budget plans.
 -
 A presentation slide deck from Rego University 2022. Document reviews the 7 trends that Rego is seeing in the PPM space.
- Trend 1: Going Beyond Strategic Alignment
- Trend 2: Pivoting Quickly
- Trend 3: Value Scrutiny for PPM
- Trend 4: Hybrid Financial Management
- Trend 5: AI has the Buzz, Predictive Analytics has the Momentum
- Trend 6: Balanced Ecosystem of Tools
- Trend 7: Collaboration
-
 The Financial Summary by Transaction Class provides a visual graph for each year’s financial picture for multiple years. Report contains the following items: KPIs: Displays total benefit, capital, expense and net cash flow for the selected filter criteria Grid: Displays year wise break up of benefit, capital, expense and net cash flow for the selected filter criteria Graph: Benefit, capital, expense and net cash flow are depicted in graphical way for multiple years. This report will show the user where they need to concentrate their efforts in order to meet financial commitments. User can further narrow their search by OBS Type & Path.
 -
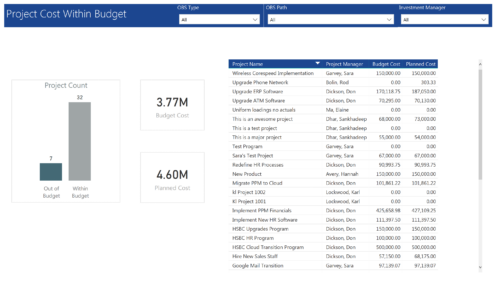 Project Cost within Budget report displays count of projects that are within or exceeding budget in the form of a bar chart. It also displays Total budget cost and Planned cost. User can further drill down the details to investment level. You can further narrow your search by OBS Type & Path and Investment Manager.
 -
 Do you want to understand the OOTB configuration and functionality of financial management? In this class, we will review the OOTB objects, views, views, and functions of financial plans, rates, and other related areas. We will cover both newUX gaps from classic. We will discuss best practices.
 -
 This training document is a Rego Consulting Quick Reference Guide to assist with the creation of Budget Plans in Clarity’s Modern User Experience. The document reviews submission of a cost plan for approval, approving or rejecting submitted budgets and Budget Plan facts.
 -
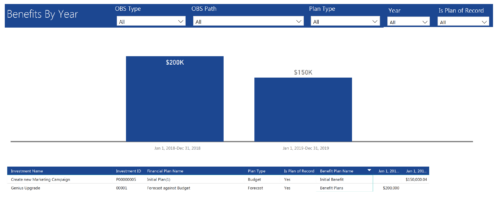 Benefits by year report provide the project manager a single place to view Benefit plan (Forecast /Budgeted) and its associated benefit for various years across multiple projects. Information is displayed in a bar graph and user can further drill down the details to investment level. Project Managers can use this report to analyze if the projects are giving intended benefits and take appropriate decisions accordingly. User can further narrow their search by OBS Type & Path, Plan Type (Budget/Forecast), Year and Is Plan of Record?.
 -
 A Quick Reference guide to assist in the creation and management of project cost and budget plans in Clarity’s Modern UX. Reviews the access of project details from the Project Grid or Tile views, creation of a cost and budget plan, and edits to those plans.
 -
 Many times Roles are spread out geographically or by function and these Roles will have different rates. For example, a developer in India may charge $25/hour vs a Developer in US may charge $50/hour. When the project team has a requirement of several developers, the PM will have to add a region specific role (Developer-US, Developer-India) so that the right rates can be applied when a cost plan is created. This creates a challenge in terms of Resource Management. As the Demand and Capacity can be spread between different region specific roles. Proper configuration on the Rate Matrix can allow you to have one Role name but different rates based on Location or Department. This allows greater flexibility and takes away the redundancy of Role Names. You can do so with the Project Team Member Properties.
 -
 Do you want to understand the OOTB configuration and functionality of financial management? In this class, we will review the OOTB objects, views, views, and functions of financial plans, rates, and other related areas.
 -
This training document is a Rego Consulting Quick Reference Guide to assist with the management of project Financials in Clarity’s Modern User Experience. This doc references version 16.3 views. Document includes summary information on the Financials module and provides detail on how to customize the grid and save views. Instructions are provided on how to filter data and how to use the ⋮ (vertical ellipses) icon to access further features. Detail is provided on the group by function, the column panel, the export of cost plan and editing cost plan and budget plan data from the grid.
-
This training document is a Rego Consulting Quick Reference Guide to assist with Financial Actuals and Reporting in Clarity’s Modern User Experience. This doc references version 16.3 views. Document includes detail on which jobs should be run to ensure project and financial data is synchronized with the latest posted actuals. Information is provided on how to analyze cost plans and how to review actual transactions. Instructions are provided on how to analyze budget plans.
-

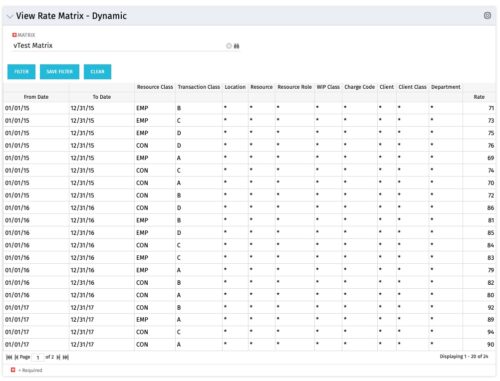 View Rate Matrix is a grid portlet that provides users a single place to view all the rates defined across multiple rate matrix without going to administration tab. Each Matrix may be defined with different columns (ex: Charge Code, Client, Department, Entity, Input type Code etc). This portlet dynamically brings only the columns associated with that rate matrix and provides the detailed information. User can view information related to one matrix at a time.
 -
This training document is a Rego Consulting Quick Reference Guide to assist with the creation of Cost Plans in Clarity’s Modern User Experience. Instructions are provided on how to access Cost Plans from the Financials tab and how to create a new Cost Plan. Detail is provided on how to create a cost plan with project information (Populate from Allocations and Populate from Assignments), how to manually enter data into a cost plan and how to set a cost plan as the Plan of Record.
-

A presentation slide deck from Rego University 2022. This document reviews the best practices for Financial Management in Clarity. - Involve the Finance Team
- Finance will drive financial classifications, resource rates, and capitalization rules
- Keep Things as Simple as Possible
- Streamline financial classifications in both the Estimation and Actuals processes
- Clarity is Not the Company’s Financial System of Record – it is a Project and Portfolio Management System
- Clarity may never match general ledger or project accounting module 100%
- Spend Time on the Full Architecture – Current and Future State
- Start With Required Outputs and Work Backward
- Integrate to Avoid Duplicate Entry
- Involve the Finance Team
-
 This training document is a Rego Consulting Quick Reference Guide to assist with the creation of financial plans within Ideas in Clarity’s Modern User Experience. This doc references version 16.3 views. Document includes instructions on how to create cost plans, budget plans and benefit plans.
 -
 To effectively practice Agile at scale, Clarity teams first need to identify various needs. This includes thinking through considerations for funding, investment prioritization, and spend management practices.
 -
 This training document is a Rego Consulting Quick Reference Guide to assist with the creation of Benefit Plans in Clarity’s Modern User Experience. The document reviews the process to create a benefit plan and then add it to a cost plan.
 -
This training document is a Rego Consulting Quick Reference Guide to assist with the management of Budget Plans in Clarity’s Modern User Experience. This doc references version 16.3 views. Doc provides detail on how to submit a cost plan for approval, how to approve or reject submitted budgets and also provides additional detail on the rules that apply to the submission of budget plans.
-
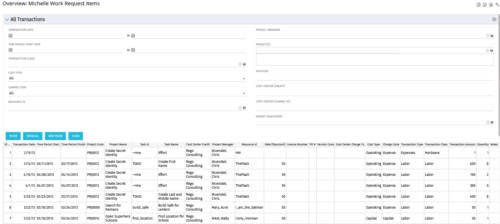 The All Transactions portlets have the capability to display any transaction within the system. Transactions from any type of investment can be viewed on this page. There are two version of this process:
- All Transactions (with security) – this will display rows only where the logged in resource has access to cost plans for projects or ideas. The portlet will check instance, OBS and global rights.
- All Transactions (without security) – will display all rows, regardless of cost plan access rights.
Column Label Description ID An unique identifier for each row displayed in the portlet. Transaction Date The data the transaction has been coded to. Time Period Start For transactions arising from timesheet entries, this will show the start period of the timesheet. Time Period Finish For transactions arising from timesheet entries, this will show the finish period of the timesheet. Project Code The ID of the investment. Project Name The name of the investment. Task ID The ID of the investment task where the actual cost has been assigned. Task Name The name of the investment task where the actual cost has been assigned. Cost Center Credit The department assigned to the resource where a cost needs to be credited. Project Manager The resource managing the investment. Resource ID The ID for the resource that has been assigned the cost. Rate (Standard) The rate for the cost. Invoice Number The invoice number. May come from a manual transaction or may be imported from a financial system integration. PO # The purchase order number. May come from a manual transaction or may be imported from a financial system integration. Vendor Code The vendor code that has been listed against the transaction. Cost Centre Charge To The department assigned to the resource where a cost needs to be charged. Cost Type Indicates whether the transaction is capital or operating. Charge Code The charge code assigned to the transaction as per the Clarity Charge Code list. Transaction Type Labour, Expense, Equipment or Material. Transaction Class The transaction class assigned to the transaction as per the Clarity transaction class list. Transaction Amount Rate x Quantity. Quantity The number of units. Notes Free text field for the transaction. -
 This training document is a Rego Consulting Quick Reference Guide to assist with accessing Project Financials in Clarity’s Modern User Experience.
 -
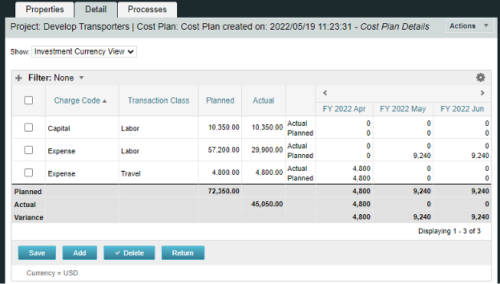
A process creating a new Cost Plan. Cost Plan properties:
Pre-conditions:Name Cost Plan created on: yyyy/mm/dd hh:mm:ss Grouping attributes Charge Code, Transaction Type Start Period The earliest fiscal period with Actuals (from PPA_WIP table) or current period, if there are no actuals Finish Period The latest fiscal period with a non-zero allocation (from PRJ_BLB_SLICES table, SLICE_REQUEST_ID = 6 Period Type Monthly Plan of Record True Planned Cost For periods in the past – from Actuals (Charge Code, Transaction Type, Quantity (Units), Cost (Amount) taken from Transactions (PPA_WIP & PPA_WIP_DETAILS); For current and future periods – from Allocations (Charge Code taken from the Project, Transaction Class from the Resource, Quantity from allocation slices, Cost from the Rate Matrix (NBI_PROJ_RES_RATES_AND_COSTS table) - the Project must be financially enabled.
- if a new Team Member is added, Rate Matrix job must be run, so the rates are populated in the NBI table.
- if the Allocation changes, allow the timeslice job to finish before running the process.
- the Project should have the Charge Code set.
-
 Does project and idea estimation take too long and lack visibility? This class will address one of the most common pain points within organizations: how to involve the right people within a timely project estimate. Learn some Rego best practices for defining, calculating, and modifying idea and project estimates, so you can increase throughput and ROI.
 -
 Are you considering the use of CA PPM's benefits tracking for planned and/or realized benefits? This session will be a review of common use cases for putting benefits forecasts and realized benefits into CA PPM along with the reporting available out of the box and within RegoXchange.
 -
This workflow is run as a scheduled or immediate Job to populate Project Cost Plans. It can be configured to run on any desired set of projects. It can be configured to populate the Cost Plan of Record based on Allocations or based on Assignments.
-
 The Rego PowerBI Reporting Suite features close to 100 free PowerBI reports, designed to enhance project management and reporting capabilities.
 -
 Are you struggling with implementing Agile tools in your organization in addition to Clarity? This class will review best practices for implementing Agile tools in conjunction with Clarity - living in a Bi-Modal world. We will discuss how Clarity can be used to govern both types of work and teams and how Agile tools should interface into Clarity.
