-
 A Quick Reference Guide to assist in the staffing of an Idea in Clarity’s Classic UX.
 -
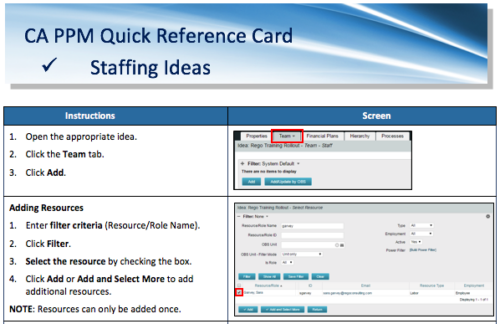 A Quick Reference Card to assist in adding resources and roles to Ideas in the Classic UX. Updating Allocation is also covered.
 -
 Ideas by Department report is a pie chart that displays count of ideas by department. Mouse over on the pie chart displays idea count for that department. You can further narrow your search by OBS Type & Path , Idea Status, Idea Start Date and Is Idea Active?.
 -
 Ideas by Business Unit report is a pie chart that displays count of ideas per business unit. This report gives a holistic view of the idea pipeline in an Organization and provides information on number of ideas converted, approved & unapproved per business unit. You can further narrow your search by Idea Status, Ideas Start Date and Is Idea Active?.
 -
 Do you want to talk to other customers that are using or plan to use demand management? In this moderated round table, customers can share experiences and provide insights on process, configurations, challenges, and successes. We will divide into small groups and discuss customer selected topics—100% sharing.
 -
 Funnel Chart displays aggregated counts of Ideas by “Idea Progress”, a custom attribute. Chart shows Idea Progress names in legend, and count total is available as a mouse-over. No filters available on this portlet.
 -
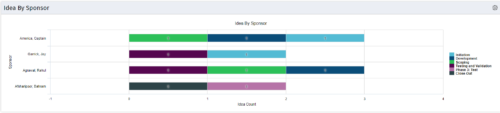 This portlet uses a bar graph to show the count of ideas by stage - grouped by the sponsor OBS. The X-axis displays the count and the Y-axis denotes the sponsor.
 -
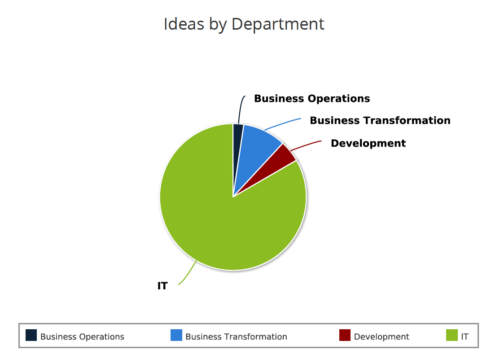
 Pie Chart displays count of all Ideas by Department. Filterable by Active and Inactive, by OBS, and by Department Manager. Data label and mouse-over show department counts. Legend displays department names.
 -
Pie Chart displays count of all Ideas by Department. Filterable by Active and Inactive, by OBS, and by Department Manager. Data label and mouse-over show department counts. Legend displays department names.
-
Pie Chart displays count of all Ideas by Department. Filterable by Active and Inactive, by OBS, and by Department Manager. Data label and mouse-over show department counts. Legend displays department names.
-
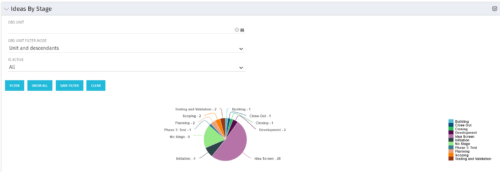 Pie Chart displays count of all Ideas by stage. Filterable by Active and Inactive, and also by OBS. Data label and mouse-over show Stage counts. Legend displays Stage names. This portlet assumes the use of the custom Stage attribute on Idea object.
 -
Pie Chart displays count of all Ideas by stage. Filterable by Active and Inactive, and also by OBS. Data label and mouse-over show Stage counts. Legend displays Stage names. This portlet assumes the use of the custom Stage attribute on Idea object.


Copyright 2023 • Rego Consulting Corporation • Privacy Policy