-
 This is a great way to review demand by type and evaluate where demand is coming from and who will be impacted. Displays a bar graph of all ideas group by type.
 -
This is a great way to review demand by type and evaluate where demand is coming from and who will be impacted. Displays a bar graph of all ideas group by type.
-
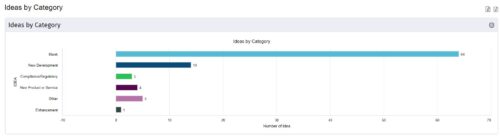
 This is a great way to review demand by type and evaluate where demand is coming from and who will be impacted. Displays a bar graph of all ideas group by type. Provides the ability to drill down into a bar to see which ideas are part of the bar.
 -
This is a great way to review demand by type and evaluate where demand is coming from and who will be impacted. Displays a bar graph of all ideas group by type. Provides the ability to drill down into a bar to see which ideas are part of the bar.
-
 This portlet pulls back the Availability and Allocation totals by Role between a user-specified Start and Finish Date, then the user can drilldown to look at the information for Applications. The Time Period filter allows for comparing these values across different timeframes (monthly, weekly, quarterly, annual) as desired. Other filters allow for looking at Active or Inactive Roles (or both) and including Active or Inactive Projects (or both) in the totals.
 -
This portlet pulls back the Availability and Allocation totals by Role between a user-specified Start and Finish Date, then the user can drilldown to look at the information for Applications. The Time Period filter allows for comparing these values across different timeframes (monthly, weekly, quarterly, annual) as desired. Other filters allow for looking at Active or Inactive Roles (or both) and including Active or Inactive Projects (or both) in the totals.
-
 Part of the Business Transformation Content collection, this bar chart portlet displays count of ideas per business unit. This provides a holistic view of the idea pipe-line in an organization providing them a high-level of ideas converted, approved, unapproved per business unit.
 -
Part of the Business Transformation Content collection, this bar chart portlet displays count of ideas per business unit. This provides a holistic view of the idea pipe-line in an organization providing them a high-level of ideas converted, approved, unapproved per business unit.
-
Part of the Business Transformation Content collection, this bar chart portlet displays count of ideas per business unit. This provides a holistic view of the idea pipe-line in an organization providing them a high-level of ideas converted, approved, unapproved per business unit.
-
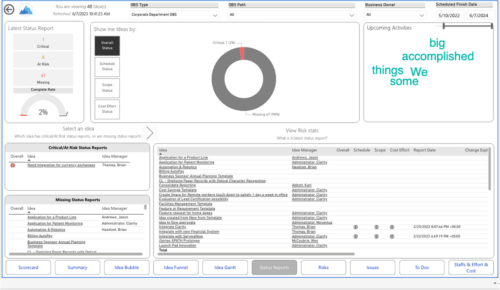
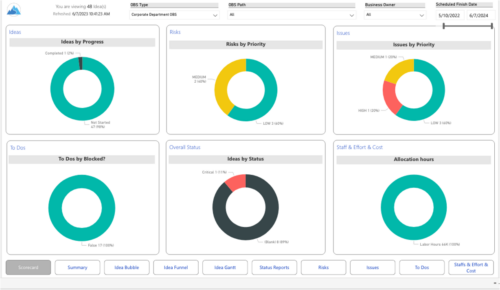 Master your pipeline as you prioritize, visualize, and analyze ideas, assess their feasibility, and track progress from inception to execution. Report Views include:
- Idea Bubble
- Idea Details
- Idea Funnel
- Idea Gantt
- Idea Overview
- Idea Staff and Effort
- Idea Status
- Idea To Dos
-
 Do you want to understand Best Practice of configuration and functionality for demand management? In this class, we will review the OOTB objects, views, and functions of demand management.


Copyright 2023 • Rego Consulting Corporation • Privacy Policy