-
 A Quick Reference Guide to assist in the administrative process of creating a new Clarity Blueprint. An applications administrator can use blueprints to configure different layouts for different types of projects, ideas or investments.
 -
A Quick Reference Guide to assist in the administrative process of creating a new Group in Clarity. A group is a collection of users that require the same set of access rights. Access rights are generally granted to groups (and not directly to users).
-
A Quick Reference Guide to assist in the administrative process of adding an attribute to a Clarity object. Attributes store information associated with object views. For example, Start and Finish are a Date type attributes and Project Type is a lookup type attribute on the Project object.
-
A Quick Reference Guide to assist in the administrative process of creating a new Clarity OBS. An Organizational Breakdown Structure (OBS) is a hierarchical structure that can be used to align resources, projects and investments. An OBS can be used for reporting and access control based on OBS membership. Note: the following steps apply when creating a non-financial OBS. The financial OBS (Department and Location OBS) are generally setup as part of the Clarity implementation.
-
A Quick Reference Guide to assist in the administrative process of populating a Rate Matrix in Clarity. A rate matrix is used during cost plan population and financial transaction processing to determine costs and rates. You can create cost and rate matrices for labor, materials, equipment, and expense resources.
-
A Quick Reference Guide to assist in the administrative process of updating an Attribute Color in Clarity. The display mappings of an attribute can be configured to indicate a range of values or specific values using colors.
-
A Quick Reference Guide to assist in the administrative process of updating an OBS in Clarity. An Organizational Breakdown Structure (OBS) is a hierarchical structure you can use to align resources, projects and investments. Note: the following steps apply when updating a non-financial OBS. The financial OBS (Department and Location OBS) are generally setup as part ofthe Clarity implementation.
-
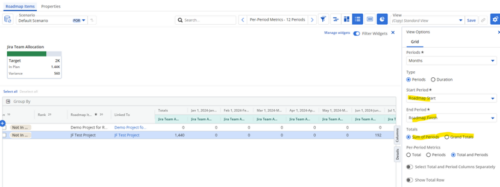
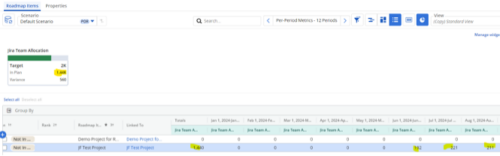 Capture and present allocation data by Team for the Investments included in your Roadmap to enable the ability to compare to Targets or Limits. Allocation data can be presented in Hours or FTE, for Teams Only.
 -
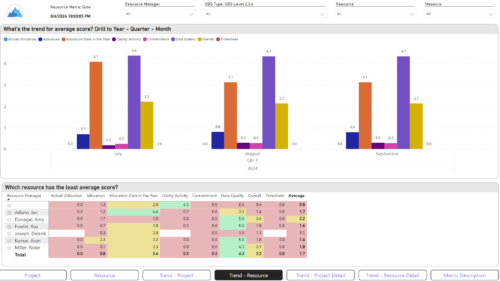
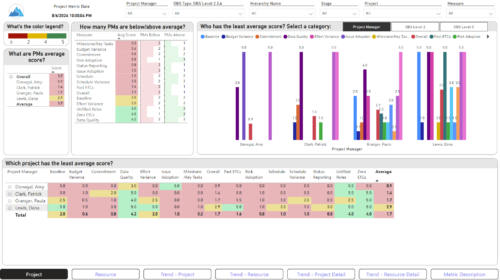 The Adoption Dashboard is designed to enhance data integrity and project tracking within Clarity by providing insights into how well users are populating and managing their project and resource data. Features: · Project Data Quality Evaluate the accuracy of project status reporting, risk, issue tracking, and schedule adherence. · Resource Data Quality Assess how well resource managers are managing timesheets, allocations, and actual utilization. · Adoption Scoring View Rate the consistency of data entry across projects and resources on a scale of 0-5, helping identify areas needing improvement. · Variance Analysis View Track discrepancies in project schedules, effort, budgets, and resource commitments. · Compliance Monitoring Ensure that all necessary project and resource data is up-to-date, aiding in more informed decision-making and better project outcomes.
 -
 Are you struggling with implementing Agile tools in your organization in addition to Clarity? This class will review best practices for implementing Agile tools in conjunction with Clarity - living in a Bi-Modal world. We will discuss how Clarity can be used to govern both types of work and teams and how Agile tools should interface into Clarity.
 -
 The movement from managing technology organizations and development by Products instead of Projects has grown in recent years. This has many advantages, but only if there are critical changes in defining and funding the development. First, we shift from defining specific solutions to developing and defining the outcomes we want to accomplish with that development. Second, we should rethink how we fund development. Instead of funding a specific scope of work, we should fund the capacity to develop products.
 -
 Hershey shares their path to Power BI reporting. They discuss Power BI ways of working, Defining Executive Level Metrics, Design & Development, and Next Level Reporting.


Copyright 2023 • Rego Consulting Corporation • Privacy Policy