-
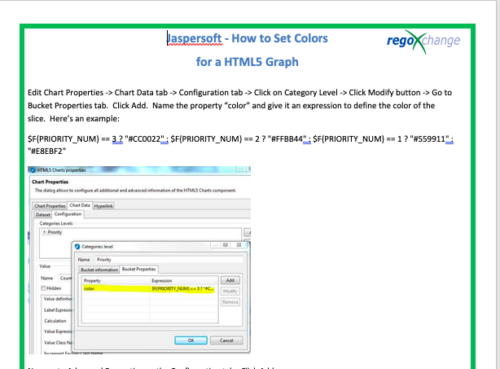 This tech-trick details the steps to set colors for an HTML5 Graph.
 -
 JasperSoft as two font databases – one for display and one for pdf exporting. Not all fonts in the display database are in the exporting database. If you find you are not getting the proper fonts when exporting to PDF from JasperSoft this tech trick will show you how to add the missing font so your report exports as expected.
 -
 The Communications Portlet - Simple portlet provides a simple mechanism to communicate with Clarity users. The content of the porlet can be edited easily through the Portlet administration screens within Clarity. This is a very beneficial method of delivering messages to your Clarity users all at the same time.
 -
 An HTML portlet that displays two buttons that link the user instantly to an object create page. The portlet comes with two buttons and the buttons can be modified to link to any creation page. Administrator can choose: Project, Idea, Application, Program, etc.
 -
 This training document is a Rego Consulting Quick Reference Guide to assist with the creation and editing of Tasks in the Timeline View of Clarity’s Modern User Experience. This doc references version 16.0.3 views. Doc covers how to create a new task in the Timeline View, how to insert sibling or insert child tasks, how to set Milestones, access the Details pane and add resource Assignments. Also details how to move tasks by clicking and dragging within the Timeline View.
 -
 This training document is a Rego Consulting Quick Reference Guide to assist with Financial Actuals and Reporting in Clarity’s Modern User Experience. This doc references version 16.0.2 views. Document includes detail on which jobs should be run to ensure project and financial data is synchronized with the latest posted actuals. Information is provided on how to analyze cost plans and how to review actual transactions. Instructions are provided on how to analyze budget plans.
 -
 This training document is a Rego Consulting Quick Reference Guide to assist with General Navigation in Clarity’s Modern User Experience. This doc references version 16.0.2 views. Doc reviews the Menu Bar and User Tool Bar. Document provides instructions on how to access blueprints, create a new blueprint and edit the fields available on the blueprint. Detail is also provided on how to update the modules, rules and actions associated with a blueprint. Instructions are listed to show the user how to modify the create from template page, how to add a new channel and how to set a default blueprint. Tips on the user of the API Attribute ID are also provided.
 -
 This training document is a Rego Consulting Quick Reference Guide to assist with the creation and editing of Tasks in the Timeline View of Clarity’s Modern User Experience. This doc references version 16.0.2 views. Doc covers how to create a new task in the Timeline View, how to insert sibling or insert child tasks, how to set Milestones, access the Details pane and add resource Assignments. Also details how to move tasks by clicking and dragging within the Timeline View.
 -
 The Clarity Health portlet provides a quick glance into the health of key components and critical jobs in the Clarity environment. The following metrics are monitored: Process Engine Heartbeat should refresh itself every 10 minutes. Process Engine is responsible for the triggering of processes. Green <= 10 Minutes, Yellow 11-15 Minutes, Red > 15 Minutes Time Slices Time Slices are required for accurate reporting. Best practice is for the Time Slicing job to run every minute. Please note there are some jobs that will cause the time slicing to delay so a momentary delay is normal. Green <= 10 Minutes, Yellow 11-15 Minutes, Red > 15 Minutes Datamart Extraction Green <= 24 Hours, Yellow 24-48 hours, Red > 48 hours Datamart Rollup Green <= 24 Hours, Yellow 24-48 hours, Red > 48 hours Rate Matrix - Full Best practice is to run a full rate matrix nightly Green <= 24 Hours, Yellow 24-48 hours, Red > 48 hours Rate Matrix - Incremental Green <= 24 Hours, Yellow 24-48 hours, Red > 48 hours Load Data Warehouse - Full Load Green <= 24 Hours, Yellow 24-48 hours, Red > 48 hours Load Data Warehouse - Incremental Green <= 24 Hours, Yellow 24-48 hours, Red > 48 hours Load Data Warehouse Access Rights Green <= 24 Hours, Yellow 24-48 hours, Red > 48 hours The Clarity Health portlet provides a quick glance into the health of key components and critical jobs in the Clarity environment. The following metrics are monitored: Process Engine Heartbeat should refresh itself every 10 minutes. Process Engine is responsible for the triggering of processes. Green <= 10 Minutes, Yellow 11-15 Minutes, Red > 15 Minutes Time Slices Time Slices are required for accurate reporting. Best practice is for the Time Slicing job to run every minute. Please note there are some jobs that will cause the time slicing to delay so a momentary delay is normal. Green <= 10 Minutes, Yellow 11-15 Minutes, Red > 15 Minutes Datamart Extraction Green <= 24 Hours, Yellow 24-48 hours, Red > 48 hours Datamart Rollup Green <= 24 Hours, Yellow 24-48 hours, Red > 48 hours Rate Matrix - Full Best practice is to run a full rate matrix nightly Green <= 24 Hours, Yellow 24-48 hours, Red > 48 hours Rate Matrix - Incremental Green <= 24 Hours, Yellow 24-48 hours, Red > 48 hours Load Data Warehouse - Full Load Green <= 24 Hours, Yellow 24-48 hours, Red > 48 hours Load Data Warehouse - Incremental Green <= 24 Hours, Yellow 24-48 hours, Red > 48 hours Load Data Warehouse Access Rights Green <= 24 Hours, Yellow 24-48 hours, Red > 48 hours
 -

Rego’s Clarity Adoption Metrics package consists of two sets of metrics: Project metrics, and Resource metrics. Project metrics measure how effectively project managers are using Clarity to manage their projects. Resource metrics measure how effectively resource managers are using Clarity to manage resources. Metrics are scored on a scale of 0 to 5, with higher scores indicating greater adoption and use. All metrics can be viewed numerically or graphically, and can be broken out by OBS. In addition, metric data can display as a 12-month rolling history to help identify trends. Project metrics can also display by lowest / highest adoption rates for a specific resource metric or all resource metrics. There is a variety of way to view the Adoption Metric data, therefore, Rego has made this simple by creating an Adoption Metrics object that contains multiple tabs. Each tab displays one or more of the Project or Resource Adoption Metrics. Based on the nature of the Metrics some tabs will allow the ability to use a pull down menu to select a specific Adoption Metric. There is also a Metrics trending view that pulls monthly snapshots of the metrics. Project metrics consist of the following: - Project Status Reporting – Measures how well PMs create and publish project status reports.
- Project Risk Adoption – Measures how well Risks are being used and managed.
- Project Issue Adoption – Measures how well Issues are being used and managed.
- Project Schedule – Measures how well PMs create tasks and keep the project schedule current.
- Project Baseline – Measures whether or not baselines exist.
- Project Zero ETC’s – Measures how well the PM assigns resources to tasks with ETCs.
- Project Past ETC’s – Measures how many improperly scheduled tasks the PM has.
- Project Milestone / Key Tasks – Measures how well PMs create and manage Milestones / Key Tasks.
- Project Schedule Variance – Measures how effectively PMs manage their schedules.
- Project Effort Variance – Measures how effectively PMs manage their project efforts.
- Project Budget Variance – Measures how effectively PMs manage budgets or cost plans.
- Project Unfilled Roles – Measures project roles with allocations that are already started or starting within the next 30 days.
- Project Data Quality – Measures how effectively PMs complete the Description, Stage, Progress, Objective, and Sponsor/Business Owner fields.
- Project Commitment – Measures the hard allocations for a project over a two week time frame.
- Resource Clarity Usage – Measures how often users log into Clarity.
- Resource Timesheet – Measures if timesheets post in a timely manner.
- Resource Allocation – Measures how well RMs keep total resource allocations within the expected range for future time periods.
- Resource Actualy Utilization – Measures how well Resource allocations match actuals.
- Resource Allocation Date in the Past – Measures how many resources are open for time entry with dates in the past.
- Resource Data Quality – Measures how well RMs complete the Resource Manager and Primary Role fields and optionally the Skill and Employment Type fields.
- Resource Commitment – Measures how much resource available time is committed to projects.
-
 “Of course we have a plan for PPM!” This might be the response of any organization that’s considering PPM or has a solution in place. But having the technology doesn’t necessarily mean having an effective plan for it. This white paper breaks down what it means to have a strategic PPM roadmap, and why your organization should always keep it current and close at hand. We’ll define the elements that make a roadmap effective and provide seven reasons it can make the business journey worthwhile. This White Paper is downloaded from the Rego Consulting site. You will be asked to provide your email address and current ppm tool. - http://info.regoconsulting.com/ppm-roadmap-white-paper ** No Download - Do not Add to Cart **
 -
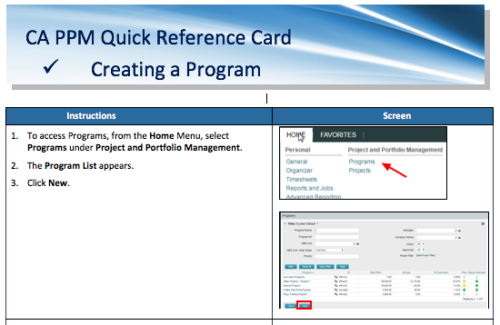 A Quick Reference Card to assist in the creation of a Program.


Copyright 2023 • Rego Consulting Corporation • Privacy Policy