-
 This training document is a Rego Consulting Quick Reference Guide to assist with the creation of Benefit Plans in Clarity’s Modern User Experience. This doc references version 16.1.2 views. Doc provides detail on how to create a Benefit Plan, how to categorize Benefit Class and Benefit Subclass, how to add financial values to your Benefit Plan, and how to add the Benefit Plan to your Cost Plan.
 -
 This training document is a Rego Consulting Quick Reference Guide to assist with General Navigation in Clarity’s Modern User Experience. This doc references version 16.1.2 views. Doc reviews the Menu Bar and User Tool Bar. Document provides instructions on how to access blueprints, create a new blueprint and edit the fields available on the blueprint. Detail is also provided on how to update the modules, rules and actions associated with a blueprint. Instructions are listed to show the user how to modify the create from template page, how to add a new channel and how to set a default blueprint. Tips on the user of the API Attribute ID are also provided.
 -
 This training document is a Rego Consulting Quick Reference Guide to assist with Staff Grid in Clarity’s Modern User Experience. This doc references version 16.1.2 views. Document provides detail on the use of the Staff Grid in the Staffing Modules in the Common Component functionality.
 -
 This training document is a Rego Consulting Quick Reference Guide to assist with the adding of resources to the Staff tab for Ideas in Clarity’s Modern User Experience. This doc references version 16.1.2 views. Document provides detail on how to add resources to the Staff tab, Default Allocation % and Per-Period metrics.
 -
 This training document is a Rego Consulting Quick Reference Guide to assist with Time Entry Administration Settings for Timesheets. This doc references version 16.1.2 views. Document provides detail on Timesheet Options for the Modern UX and how to enable end user column configuration. Detail is also provided on how end users may configure their timesheet view.
 -
 This training document is a Rego Consulting Quick Reference Guide to assist with the utilization of the My Workspace area within Clarity’s Modern User Experience. This doc references version 16.1.2 views. Document reviews Checklists, Smartlists and To Do’s.
 -
 "Ensure you are keeping tabs on your Clarity environment. Clarity has key components that require monitoring to ensure consistent processing: - identify key modules like processes, jobs, financials, among others - identify customizations and common errors that can be improved"
 -
 Do you want to know more about building integrations quickly and easily? We will also show Rego's data processor and extraction tool and how it can be used for all outbound file based integrations to save money and time.
 -
 This training document is a Rego Consulting Quick Reference Guide to assist with the use of Sub-Objects and Channels in Clarity’s Modern UX.
 -
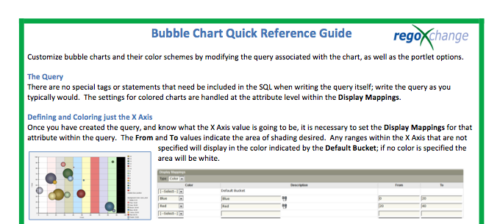 The Bubble Chart Quick Reference Guide provides the user instructions to customize bubble charts and their color schemes by modifying the query associated with the chart, as well as the portlet options. This is very beneficial as it allows the user to match or blend colors among all of the bubble portlets to better display the information the portlets are delivering. Similar data can be one color while different data can be its own color to better show the overall picture.
 -
 Course description: “How are other companies storing or managing documents? This session will discuss options for using native CA PPM, linking to SharePoint, connecting directly to SharePoint, using Google docs, as well as other options. This session will also discuss options for document approval workflows within CA PPM for both collaborative documents and attachment fields.” Download file is the slide deck used during the presentation.
 -
 The Action Item Reassignment – Workflow provides the ability to reassign an action item(s) that has been sent out to a resource. You first choose the resource who currently has the action item(s) sitting in their queue. Next, you choose the resource you want to reassign the action item(s) to. Finally, you select one to many action items you want to re-associate before running the process. After all the fields are set, the process can be run which will re-associate the action items from one resource to the other.


Copyright 2023 • Rego Consulting Corporation • Privacy Policy