-
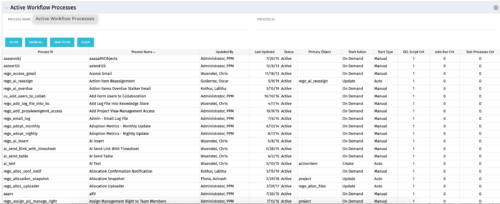 The Active Workflow Processes allows you to view all of the workflow processes within the system. It shows information about the process: the objects related, the start type, and if the process has sub-processes, jobs, or GEL scripts. This portlet is used by admins to determine how many processes are currently running in the system and on which objects. It will also display the start action, how many GEL scripts reside in the process, the run count and how many the sub-processes each process has. This information is helpful during upgrades and other testing.
 -
The Active Workflow Processes allows you to view all of the workflow processes within the system. It shows information about the process: the objects related, the start type, and if the process has sub-processes, jobs, or GEL scripts. This portlet is used by admins to determine how many processes are currently running in the system and on which objects. It will also display the start action, how many GEL scripts reside in the process, the run count and how many the sub-processes each process has. This information is helpful during upgrades and other testing.
-
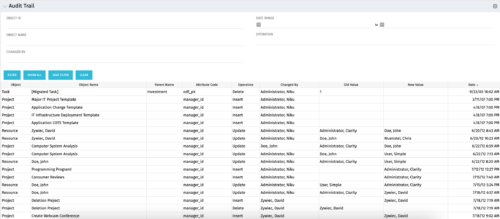 The Audit Trail portlet displays information about audited attributes. It is nearly identical to the view and functionality of the “Global Audit Trail” offering on the admin side. It offers filters for the Object ID (resource internal id, project internal id, etc.), Object Name (Jim Brown, Project A, etc.), Changed By, a date range for the changed date and the operation of the change. It is capable of reporting on the following:
- Object (Resource, Project, etc.)
- Object Name (Jim Brown, Project A, etc.)
- Parent Name (if the object were a sub-object)
- Attribute code (the attribute id from the attributes list on the object)
- Operation (Update, Insert, Delete)
- Changed By
- Old Value
- New Value
- Date Changed
-

 The Capacity Graph portlet displays Availability, Allocations, Actuals and Assignments for one or more active resource(s) in a single view. This portlet pulls data from timeslices, and allows the user to filter on a weekly, monthly or quarterly data. The Estimated Time to Complete (ETC) and Allocation data will only show for projects that are active. This portlet provides Resource Managers, PMOs and Executives with a simple way to analyse: Allocations vs. Availability, Allocations vs. Actuals, Allocations vs. ETC and ETC vs. Availability. The graph allows the user to determine where areas of improvement may exist and quickly identify potential areas of constraint. Note: the information displayed is dependent on what the user has security rights to view.
 -
The Capacity Graph portlet displays Availability, Allocations, Actuals and Assignments for one or more active resource(s) in a single view. This portlet pulls data from timeslices, and allows the user to filter on a weekly, monthly or quarterly data. The Estimated Time to Complete (ETC) and Allocation data will only show for projects that are active. This portlet provides Resource Managers, PMOs and Executives with a simple way to analyse: Allocations vs. Availability, Allocations vs. Actuals, Allocations vs. ETC and ETC vs. Availability. The graph allows the user to determine where areas of improvement may exist and quickly identify potential areas of constraint. Note: the information displayed is dependent on what the user has security rights to view.
-
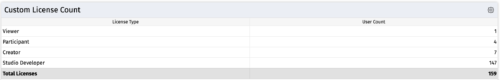 The Custom License Count portlet displays the license type and number of users with each type of license. This portlet can be modified by adjusting the query to exclude certain rights within manager licenses based on negotiated license types with CA. For example, if CA allows creation of a sub-object to Incident to be included in a Team Member license, this portlet can be used to reflect the true license counts vs. the standard CA license counts.
 -
The Custom License Count portlet displays the license type and number of users with each type of license. This portlet can be modified by adjusting the query to exclude certain rights within manager licenses based on negotiated license types with CA. For example, if CA allows creation of a sub-object to Incident to be included in a Team Member license, this portlet can be used to reflect the true license counts vs. the standard CA license counts.
-
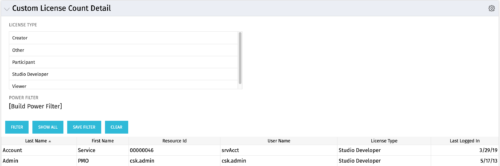 The Custom License Count Detail portlet displays the license type information for all users within Clarity as well as last login date for clean-up. This portlet can be modified by adjusting the query to exclude certain rights within manager licenses based on negotiated license types with CA. For example, if CA allows creation of a sub-object to Incident to be included in a Team Member license, this portlet can be used to reflect the true license counts vs. the standard CA license counts.
 -
The Custom License Count Detail portlet displays the license type information for all users within Clarity as well as last login date for clean-up. This portlet can be modified by adjusting the query to exclude certain rights within manager licenses based on negotiated license types with CA. For example, if CA allows creation of a sub-object to Incident to be included in a Team Member license, this portlet can be used to reflect the true license counts vs. the standard CA license counts.


Copyright 2023 • Rego Consulting Corporation • Privacy Policy