Allocation Compliance Pie Chart (Power BI)
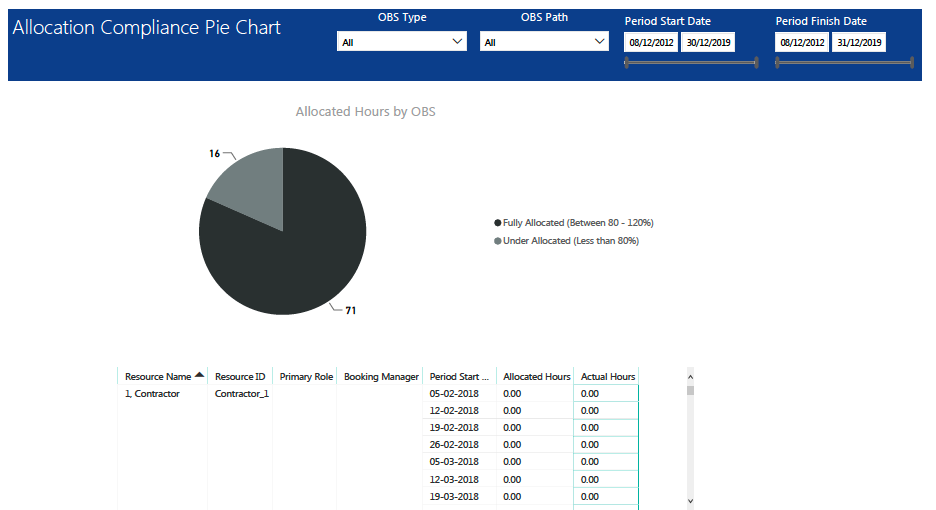
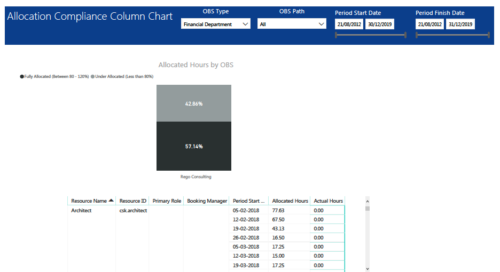
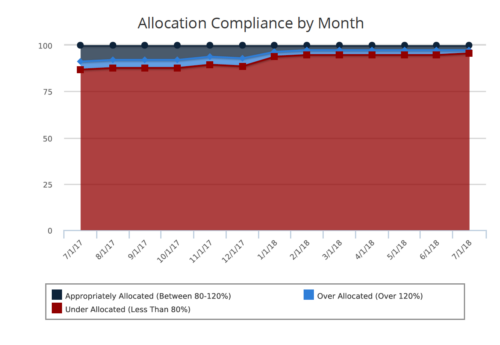
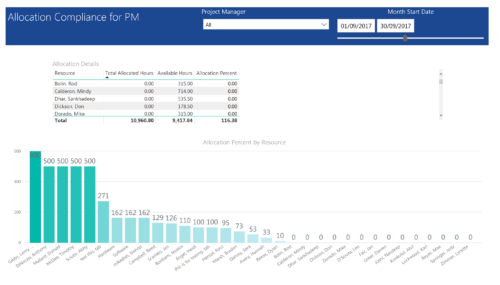
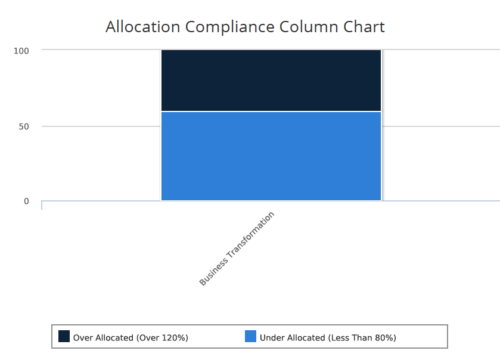
Allocation Compliance Pie Chart report provides resource managers a single place to view Allocation compliance for various resources. It displays the following:
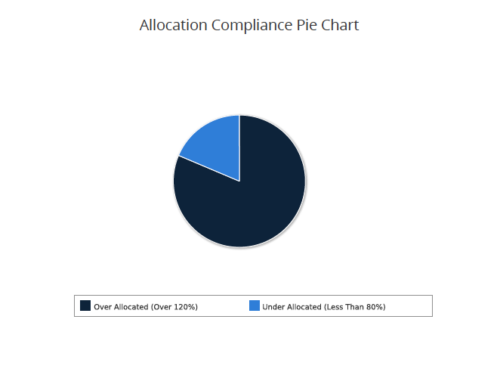
Allocated Hours by OBS chart: Pie chart that displays percentage of resources that are fully allocated (80 -120 %) and under allocated (less than 80%) for a particular OBS and selected period range.
Grid: Displays Resource Name, Resource Id, Primary Role, Booking Manager, Period, Allocated hours and Actual hours during that period.
You can further narrow your search by OBS Type, OBS Path & Period Date range.
Download Details
RegoXchange Content ID: EX1665
Submission Date:
Submitter:
Content Type: Business Intelligence
Related Modules: Allocations
Company: Rego Consulting

