-
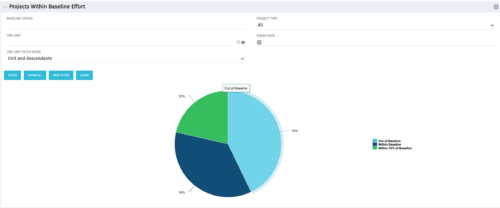 The Projects Within Baseline Effort portlet will display all projects’ baseline effort in a pie chart by three different categories: Out of Baseline, Within Baseline, and Within 10% of Baseline. This portlet is used by the PMO to provide management with a snapshot of all projects and their baselines.
 -
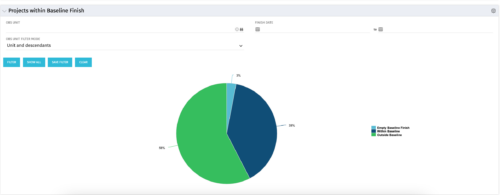 The Projects Within Baseline Finish portlet displays all projects that have a baseline and presents them in a pie chart. This portlet provides management with a way to quickly view the number of projects that are on time. The user may filter by OBS and finish date.
 -

 Pie Chart displays projects by Baseline Finish Variance—is current project finish beyond baseline finish; or is current project finish on or before baseline finish. Filterable by OBS structure and Finish Date range. Data labels show percent within baseline vs percent outside baseline. Mouse-over shows Within or Outside label and percent of total projects. Legend shows color coded Within Baseline and Outside Baseline labels. Drilldown: Clicking on a pie slice yields a grid portlet of projects either Within or Outside Baseline.
 -
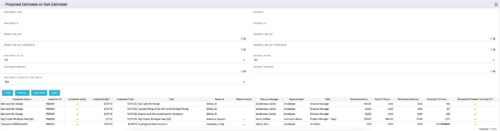 The Proposed Estimates vs. Task Estimates portlet gives the ability to identify when the Proposed Estimates for any given task exceed the Task Estimates. The portlet filters by investment name, investment ID, project OBS unit, investment active (yes/no/all), investment manager, resource name, resource ID, resource OBS unit, resource active (yes/no/all), and resource manager. Additionally, the results can be filtered by the proposed ETC greater than task ETC flag (yes/no/all). The information provided on the portlet includes the investment name, investment ID, investment active (yes/no), investment start/end dates, task name, resource name, resource active (yes/no), resource manager, total hours, total ETC, proposed ETC greater than task ETC flag (yes/no), pending actual hours, and proposed ETC hours.
 -
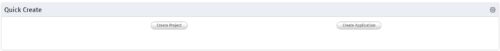 An HTML portlet that displays two buttons that link the user instantly to an object create page. The portlet comes with two buttons and the buttons can be modified to link to any creation page. Administrator can choose: Project, Idea, Application, Program, etc.
 -
 The Re-Baseline via Change Request process is a simple method for a member of the project (who has the ability to create change requests) to request a re-baseline of the project without the project manager having to perform it. First, the user must create the change request. The user must then start the process within the change request by using the Processes tab. Once started, the process will route an action item to the Project Manager. If rejected, the process will end and the user must start it again (if needed). If approved, the process will then baseline the project and close out the change request.
 -
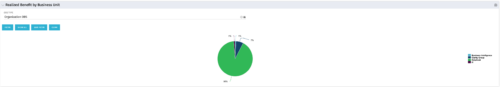 Pie Chart that aggregates Realized Benefit (Total Actual Benefit) by OBS for active projects. Only a Benefit Plan associated with the Cost Plan of Record will return data. The filter allows you to select which OBS filter you prefer to use for this pie chart, however, only an OBS associated with Projects will return data.
 -
 Part of the Business Transformation collection, this pie chart portlet displays realized benefit, grouped by location of project. This provides the PM with a holistic view of benefits realized across the geographical locations.
 -
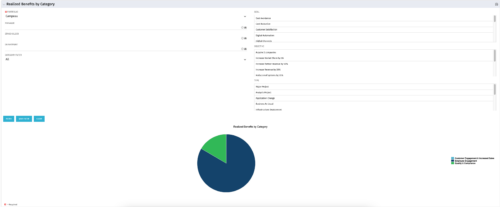 This is a pie chart portlet to show realized benefits across the system by category, including a category for no category or unspecified. Pie chart shows categories of realized benefits in its slices. Available filters:
- Portfolio (required)
- Manager
- Stakeholder
- Department
- Category Filter (default to all)
- Goal
- Objective
- Type
-

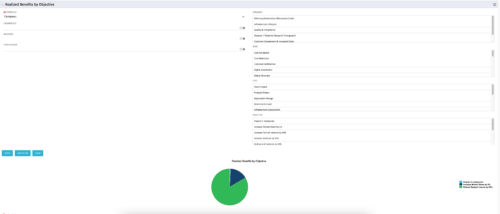 This portlet displays a Pie Chart of a Portfolio’s Realized Benefits partitioned into pie slices by the portfolio’s Investments’ Objectives. Clicking on any pie slice (Objective) drills-down into a portlet that lists the Investments that make up that slice.
 -
 Part of the Business Transformation collection, this line chart portlet displays realized vs planned benefits overtime, for portfolio investments. This provides the PfM with a holistic view of benefits planned vs realized over a period of time.
 -
 This can be used to remove all participants and their corresponding security permissions. NOTE: The ability to remove the right is with the admin only.


Copyright 2023 • Rego Consulting Corporation • Privacy Policy