-
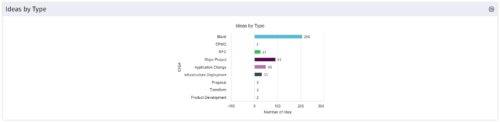 This is a great way to review demand by type and evaluate where demand is coming from and who will be impacted. Displays a bar graph of all ideas group by type.
 -
 Pie Chart displays count of all Ideas by Department. Filterable by Active and Inactive, by OBS, and by Department Manager. Data label and mouse-over show department counts. Legend displays department names.
 -
 Pie Chart displays total Ideas by Priority, filterable by Active / Inactive and by OBS structure. Data Label and Mouse-over label display counts by Priority. Legend shows Priority Name. Chart also shows Ideas with No Priority.
 -
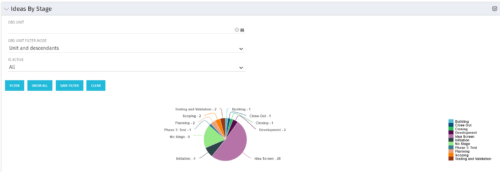 Pie Chart displays count of all Ideas by stage. Filterable by Active and Inactive, and also by OBS. Data label and mouse-over show Stage counts. Legend displays Stage names. This portlet assumes the use of the custom Stage attribute on Idea object.
 -
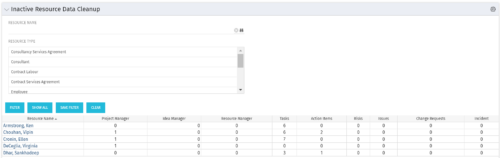 The Inactive Resource Data Cleanup portlet displays information for inactive resources that still have pending items on active objects:
- Inactive User is the Project Manager
- Inactive User is the Idea Manager
- Inactive User is the Resource Manager
- Tasks assigned to the user
- Action items assigned to the user
- Risks assigned to the user
- Issues assigned to the user
- Change requests assigned to the user
- Incidents assigned to the user
-
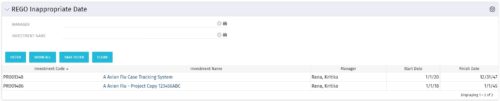 This grid portlet to show projects with finish or start date of project more than 20 years in future or past. The portlet automatically displays results when accessed. The user can apply filters to fetch the desired information.
 -
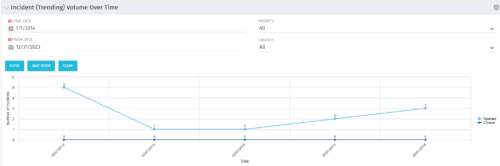 This view depicts trends of created and resolved Incidents over time, grouped by month. The count of incidents opened is determined by the Created Date of the Incident, and the count of Incidents closed is determined by the Resolution Date of the Incident. The view is filterable by Priority and Urgency as well as a date range. NOTE: The values returned are the total sum for a given month, not a cumulative total over time.
 -
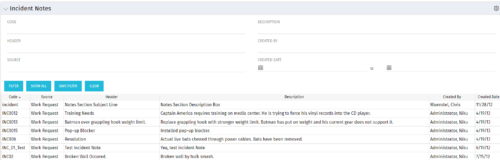 The Incident Notes portlet displays all of the notes that have been entered against Incidents in a single view. This allows users to more efficiently look at the notes, regardless of security rights, without having to enter each incident individually to view them.
 -
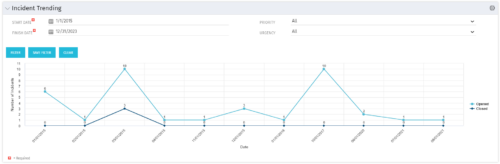 The Incident Trending portlet all opened and closed incidents within a certain time frame. This portlet will show trends in incidents over previous months and allows for analysis of as to the root cause in a spike of incidents. The information may be filtered by date range, urgency and priority.
 -
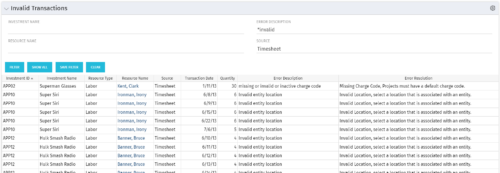 The Invalid Transactions portlet displays all of the transactions that did/will not post in Clarity. The benefit of this portlet is that you can use the filter to select a specific project, resource, or error to display all transactions associated to your selection. There are several reasons a transaction may fail to post such as inactive resource, no location or inactive location selected on the Financial sub-page, project on hold, etc. To resolve the error, the user must go into the project or resource and make the noted change. Once all corrections are complete, the Post Transactions to Financials job must be run to evaluate the corrected WIP transactions to be sure the data is now complete and accurate. If additional incorrect data is found, the transaction will fail to post again and the new error/reason will display.
 -
 Part of the Business Transformation Collection, this bubble-chart portlet displays investments per their alignment, status and total planned benefit. The: X-axis displays the alignment Y-axis displays the status Bubble-size displays the total planned benefit
 -
 The Investment Resource Rate portlet allows a user to search for effective (or missing) rates for resources across all investment types. It pulls rate information from the matrix extraction tables and includes currency conversion if the environment supports multiple currencies. The portlet can be used both to search for the rate of any given resource and to determine which resources might be missing rates when an error is generated when attempting to populate a cost plan (REVMGR-20728:Rates and Costs are both missing for one or more roles/resources).


Copyright 2023 • Rego Consulting Corporation • Privacy Policy