-
 The portlet shows the Overall Status and Budget Status and Amounts. It displays one row per project. The portlet shows the following main fields: Overall Status, Budget Status, Capital Budget, Operating Budget, Total Budget, Capital Planed, Operating Planned, Total Planned, Capital Actuals, Operating Actuals, Total Actuals, Budget Variance ($), Budget Variance (%) Displaying the budget variance allows the PM to understand of the project is over / under spent, and thus the costs planning needs to be re-visited.
 -
 The Project Status Detail report provides a comprehensive view of each project’s key elements, including team allocations, major milestones, risks, issues, and change requests. It highlights the most relevant project indicators to give stakeholders a clear understanding of project health and progress. This report supports detailed tracking and review of project performance across multiple dimensions.
 -
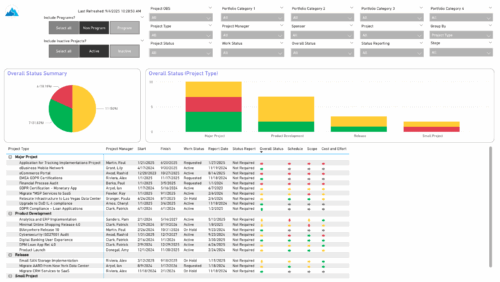 The Project Status Report List provides a consolidated view of project health, including schedule dates, work status, and key status indicators. Users can group results by Portfolio Category, Overall Status, Project Type, Stage, Project Manager, Sponsor, or OBS Level, with the report dynamically adjusting its columns based on the grouping selected. Visuals include an overall status pie chart that shows the percentage of projects by status color, and a column chart that breaks down project counts by status, aligned to the chosen grouping option.
 -
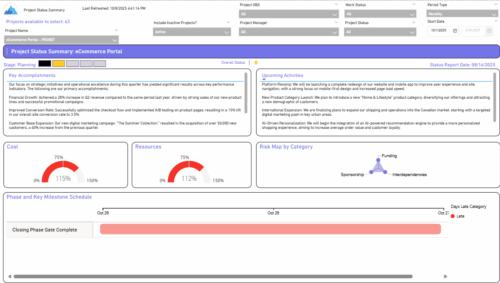 The Project Status Summary report highlights the overall health and progress of a project by summarizing key information such as current stage, status indicators, major accomplishments, upcoming activities, and resource and cost consumption. It also visualizes risk concentration across categories and includes a high-level Gantt chart showing major phases and milestones. This report provides a clear snapshot of project performance for quick executive or stakeholder review.
 -
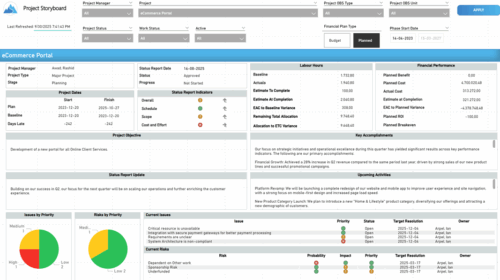 The Time Compliance report displays different frame in the displaying project information such as project dates, project objective, the amount, and cost of resources that are planned and actual, key accomplishments, upcoming activities, current issues and risks, and the project progress toward goals, and some EVM indicators for its phases.
 -
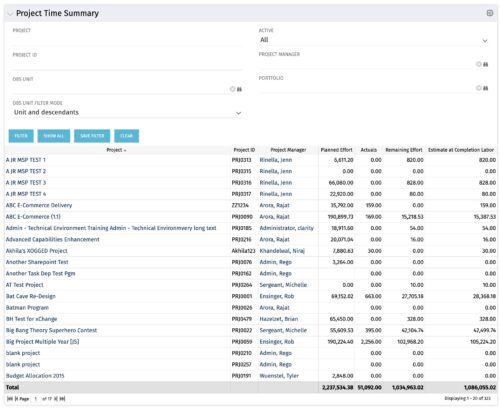 Project managers may use this portlet to show the planned effort and the remaining effort on projects. Includes actual hours as well as estimate at completion. You may narrow the results by filtering by project name, project manager, project OBS, or active flag. The portlet will display each project by ID, name, project manager, planned effort (total allocation hours), actual hours, remaining effort (ETC), and estimate at complete (actual + ETC).
 -
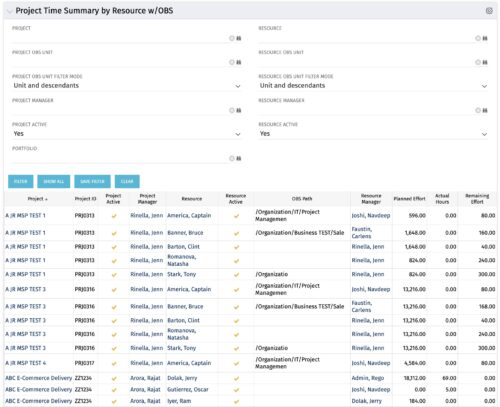 The purpose is to show actual hours, planned effort and remaining effort at the resource level, with the addition of OBS levels to support filtering and manipulation of the exported data.
 -
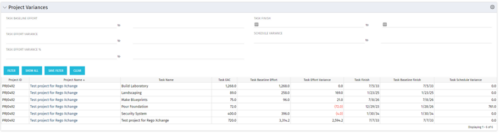 This Project Variances portlet provides a project manager a consolidated view of all of their active projects and open project tasks and shows them the baseline variance for the task EAC’s and the task start and finish dates. This gives the project manager a single place to view and manage how their projects are progressing against their baselines. The PM can easily detect when projects are running behind and pinpoint which tasks are causing the variance in the schedule.
 -
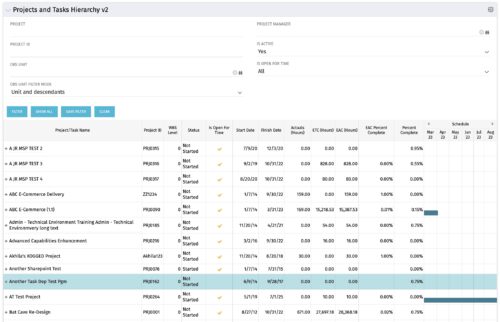 Grid Portlet displays project and task data--including name, dates, status, effort, %Complete, and schedule. Portlet initially displays project data. But there is a + sign toggle, which, when clicked, reveals task data, and the toggle becomes a – sign. User can choose to Automatically Expand all levels from Options Icon>Configure>List Column Section>Options. Portlet supports up to 10 levels of WBS. Portlet filterable by project name and ID, OBS structure, manager name, active/inactive, and open for time entry.
 -
 Horizontal Bar Graph displays total number of projects for each Business Owner/Sponsor for a selected Project Parent Stage (only Project Investments included). Vertical Axis displays Business Owner name. Horizontal Axis displays number of projects. Filter selectable for any Project Parent Stage. Color coding of bar and legend are synchronized to detail stage under the parent. Total for each detail stage displays on each segment of the bar. A mouseover displays a percent of total for each detail stage.
 -
 Pie Chart Portlet displays counts of active projects with various Stale ratings. Calculation is Percent Stale Tasks = number of open (not completed) tasks with a finish date over 15 days old, divided by total open tasks. Filterable by OBS structure and project manager. Data label = project count. Mouse-over and Legend labels = stale rating. More than 90% Stale means 90 to 100% of open tasks on a project have finish dates older than 15 days. More than 71% Stale means 71 to 89% of open tasks on a project have finish dates older than 15 days. 0 - 70% Stale means fewer than 70% of open tasks on a project have finish dates older than 15 days.
 -
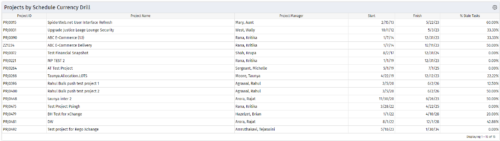
 Pie Chart Portlet displays counts of active projects with various Stale ratings. Calculation is Percent Stale Tasks = number of open (not completed) tasks with a finish date over 15 days old, divided by total open tasks. Filterable by OBS structure and project manager. Data label = project count. Mouse-over and Legend labels = stale rating. More than 90% Stale means 90 to 100% of open tasks on a project have finish dates older than 15 days. More than 80% Stale means 80 to 89% of open tasks on a project have finish dates older than 15 days. Less than 70% Stale means fewer than 70% of open tasks on a project have finish dates older than 15 days. By clicking on pie slice, a drilldown grid portlet appears with listing of projects and their Stale Ratings.


Copyright 2023 • Rego Consulting Corporation • Privacy Policy