-
 The Time By Type - Pie Chart portlet is a graphical representation of time by type of investment for all resources the logged in user has security rights to view. This portlet pulls from the daily timeslices, and can be used for determining what types of projects receive the majority of hours. The filter option allows for entry of a specific start date and finish date.
 -
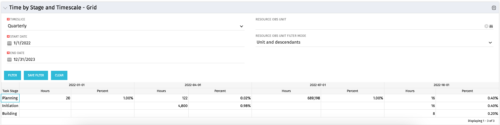 The Time by Stage and Timescale – Grid portlet displays hours for all tasks on projects by their stage for a user-defined time period. The user may narrow the results by time scale, resource OBS unit, and dates. The portlet not only provides the total hours per stage, but also the percentage of time spent on each task type. This portlet pulls data from the timeslices. Using this portlet, management can determine if excess time is being spent on a certain task stage within a project.
 -
The Time by Stage and Timescale – Grid portlet displays hours for all tasks on projects by their stage for a user-defined time period. The user may narrow the results by time scale, resource OBS unit, and dates. The portlet not only provides the total hours per stage, but also the percentage of time spent on each task type. This portlet pulls data from the timeslices. Using this portlet, management can determine if excess time is being spent on a certain task stage within a project.
-
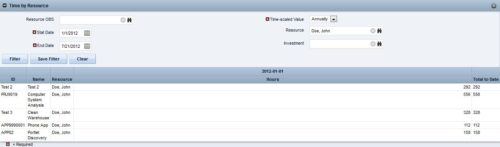
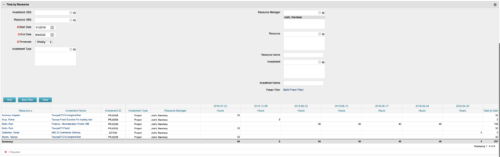 This portlet displays the actual hours resources entered against investments. The per-period actual hours can be showed in days, weeks, months, quarters, or years. The data can be filtered by Resource, Resource Manager, OBS Unit, Investment and time period
 -
This portlet displays the actual hours resources entered against investments. The per-period actual hours can be showed in days, weeks, months, quarters, or years. The data can be filtered by Resource, Resource Manager, OBS Unit, Investment and time period
-
This portlet displays the actual hours resources entered against investments. The per-period actual hours can be showed in days, weeks, months, quarters, or years. The data can be filtered by Resource, Resource Manager, OBS Unit, Investment and time period
-
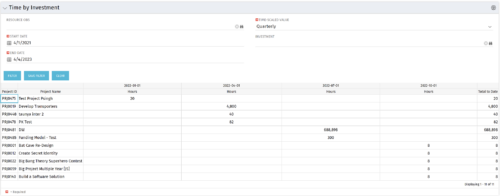
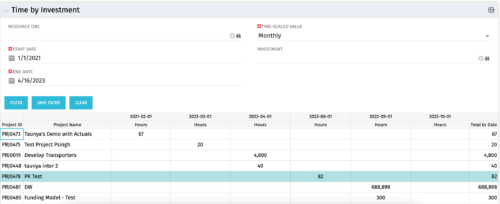 The Time by Investment portlet displays time logged to investments for all investments the logged in user has security rights to view using data from timeslices. It is capable of displaying the data by annual, quarterly, monthly, weekly, and daily segments with totals per date also being presented. The portlet may can be filtered by investment, resource OBS, and time segments. This portlet can be used as a management and governance tool to review aggregate hours posted to investments by time period.
 -
The Time by Investment portlet displays time logged to investments for all investments the logged in user has security rights to view using data from timeslices. It is capable of displaying the data by annual, quarterly, monthly, weekly, and daily segments with totals per date also being presented. The portlet may can be filtered by investment, resource OBS, and time segments. This portlet can be used as a management and governance tool to review aggregate hours posted to investments by time period.
-
 The Time by Investment portlet displays time logged to investments for all investments the logged in user has security rights to view using data from timeslices. It is capable of displaying the data by annual, quarterly, monthly, weekly, and daily segments with totals per date also being presented. The portlet may can be filtered by investment, resource OBS, and time segments. This portlet can be used as a management and governance tool to review aggregate hours posted to investments by time period.
 -
 ** No Download - Do not Add to Cart ** One thing that impacts a successful project outcome more than anything else is the people resourced to do the work. Yet Resource Management is often the last part of Clarity PPM to be used because users can view it as complicated and intimidating. It doesn’t need to be. In this webinar, Rego’s expert guide Michelle Merriam-Day will walk you through the three key components to successfully using Resource Management in your organization: - Quantify your capacity - Establish investment-level demand - Leverage foundational view for analysis. There is no download for this content. Follow the link to view - http://info.regoconsulting.com/3-steps-basic-resource-management-april-2021
 -
 A presentation slide deck from Rego University 2022. A class about the goal of TCO and what it takes to achieve it.
- TCO Benefits
- Best Practices
- Deployment Tips


Copyright 2023 • Rego Consulting Corporation • Privacy Policy