-

 This training document is a Rego Consulting Quick Reference Guide to assist with the utilization of the My Workspace area within Clarity’s Modern User Experience. This doc references version 16.2.1 views. Document reviews Checklists, Smartlists and To Do’s.
 -
This training document is a Rego Consulting Quick Reference Guide to assist with Entering and Submitting Time in Clarity’s Modern User Experience. This doc references version 16.2.1 views. Document includes Accessing & Selecting Timesheets, Populate Timesheet, Updating Timesheet, Submitting Timesheet and Entering Time for Someone Else.
-
This training document is a Rego Consulting Quick Reference Guide to assist with the creation of Risks, Issues and Changes in Clarity’s Modern User Experience. This doc references version 16.2.1 views. Doc covers creating and management of these project tools.
-
This training document is a Rego Consulting Quick Reference Guide to assist with the creation of Benefit Plans in Clarity’s Modern User Experience. This doc references version 16.2.1 views. Doc provides detail on how to create a Benefit Plan, how to categorize Benefit Class and Benefit Subclass, how to add financial values to your Benefit Plan, and how to add the Benefit Plan to your Cost Plan.
-
 Learn how to use, and follow best practices with the Clarity REST APIs - Execute a REST Call - Create JSON payloads and parse JSON responses - Capture the result of the request
 -
 This class is a hands-on beginner training class on Clarity's native functionality for reporting. Learn how to build basic visuals/reports and leverage Canvas to get the most out of Clarity.
 -
 Tired of repeating the same code in your GEL scripts? Prefer not to write thirty lines just to call a REST web service? Learn tips and tricks for reusing code—like using <include> tags and Rego’s Jam Tags solution to simplify and streamline your scripts. In this session, you'll learn the functionality and advantages to using Jam Tags within your GEL scripts to accomplish tasks that were tedious, error prone, and in some cases impossible within GEL.
 -
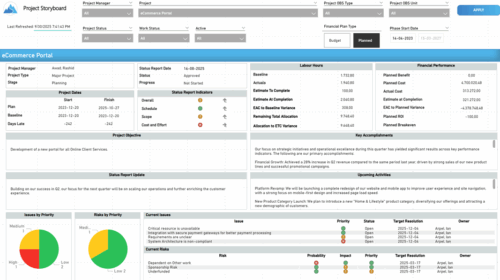 The Time Compliance report displays different frame in the displaying project information such as project dates, project objective, the amount, and cost of resources that are planned and actual, key accomplishments, upcoming activities, current issues and risks, and the project progress toward goals, and some EVM indicators for its phases.
 -
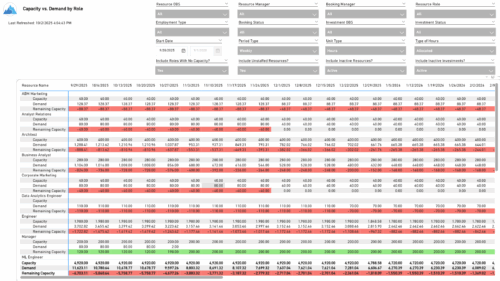 The Capacity vs. Demand by Role report provides visibility into resource utilization by comparing available capacity to actual demand across investments at the role level. It highlights capacity, demand, and remaining capacity, helping identify potential surpluses or shortfalls. Data can be viewed by week or month and displayed in either hours or full-time equivalents (FTEs) to support detailed workforce planning and analysis.
 -
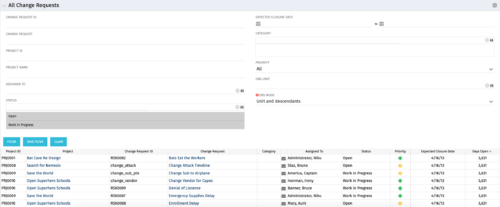 The All Change Request portlet displays all change requests related to active projects that the logged in user has view rights to. The portlet provides the project manager a single place to view change requests across multiple projects without having to go into each project individually and allows for more efficient management and reporting across projects. The filter allows the user to narrow their search by date ranges, resources involved, and/or the project with which the Change Request is associated. Other alternatives for filtering include the category, priority or status of the Change Request. In the list view, a status is displayed for each Change Request (CR), along with the Project with which the CR is associated, the CR ID, the CR name, the resource to whom the CR is assigned, Priority, Expected Closure Date, and number of days the CR has remained open. Note: Only the projects that the user has viewer rights to will show up in the list.
 -

 A presentation slide deck from Rego University 2022. Presentations by Erie Insurance, University of California, San Francisco, and The Hershey Company.
 -
 A presentation slide deck from Rego University 2022. This document is course material for an Advanced Admin class for Clarity’s Modern UX. Focus on this class was on Blueprints.
- A presentation slide deck from Rego University 2022. This document is course material for an Advanced Admin class for Clarity’s Modern UX. Focus on this class was on Blueprints.
- Pages
- Modules - Channels
- Rules
- Fields Level Security
- Actions
- A presentation slide deck from Rego University 2022. This document is course material for an Advanced Admin class for Clarity’s Modern UX. Focus on this class was on Blueprints.


Copyright 2023 • Rego Consulting Corporation • Privacy Policy