-
 This video covers the process of accessing timesheets within Clarity, both as a team member and as a Project or Resource Manager.
 -
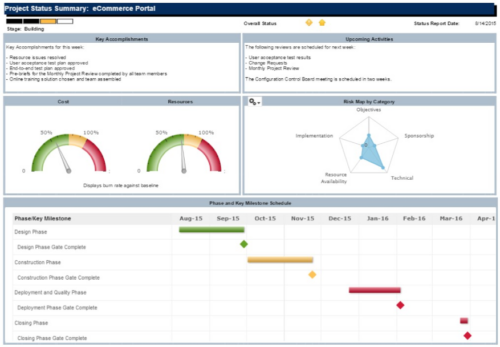 The Project Status Summary report is a transaction based Jaspersoft report that does not require the Load Jaspersoft Datawarehouse job to be run. The report will pull real-time data from the transaction tables in Clarity. This report can be run from either the Advanced Reporting or Reports and Jobs area within Clarity. The Project Status Summary report displays summary information about a project, including current stage, overall status, key accomplishments, upcoming activities, the cost and amount of resources that are consumed, mapped risks indicating categories with a high number of risks, and a high-level Gantt chart displaying information about the project phases and key milestones.
 -
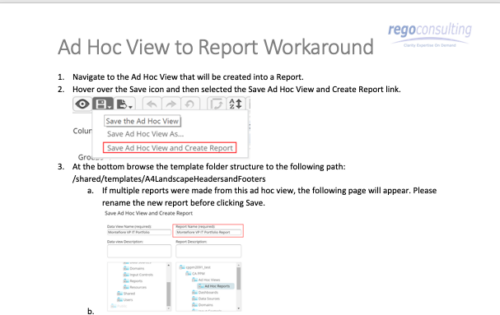 This tech-trick details the steps to convert an ad-hoc view to a report.
 -
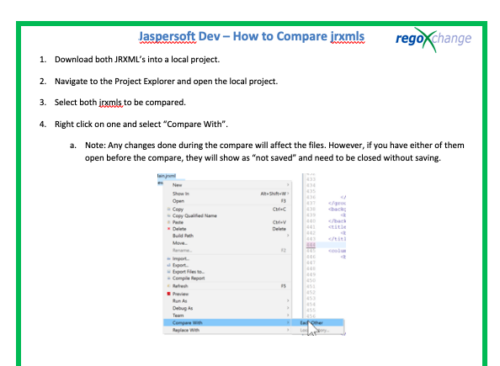 This document’s purpose is to help the reader compare jrxmls for Jaspersoft.
 -
 This tech trick document reviews the different reporting options you have in CA PPM and the benefits of each options. Jaspersoft, PowerBI and Tableau are all discussed.
 -
 Fiscal periods in DWH may need to be changed if we need to increase or decrease the number of periods for reporting.
 -
 So, you have the portlet xogged in, what now? This guide will show you how to create a page, add the portlet to the page, and add the page to the menu. This activity requires the appropriated admin rights to add content to CA PPM.
 -
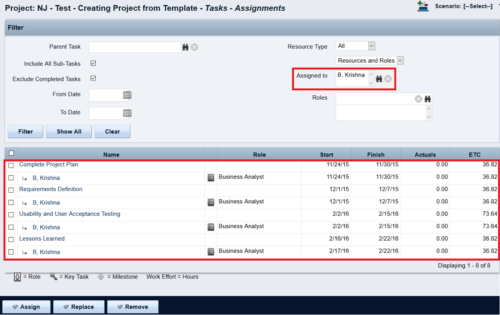
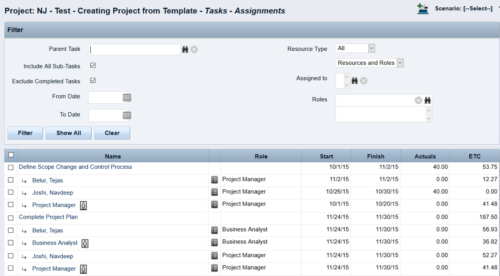 This Tech Trick walks you through the steps in CA PPM to make Bulk Role replacements on tasks. Useful when you want to make the changes to the project template which has a large WBS structure, and a lot of role assignments to tasks.
 -
 Many times Roles are spread out geographically or by function and these Roles will have different rates. For example, a developer in India may charge $25/hour vs a Developer in US may charge $50/hour. When the project team has a requirement of several developers, the PM will have to add a region specific role (Developer-US, Developer-India) so that the right rates can be applied when a cost plan is created. This creates a challenge in terms of Resource Management. As the Demand and Capacity can be spread between different region specific roles. Proper configuration on the Rate Matrix can allow you to have one Role name but different rates based on Location or Department. This allows greater flexibility and takes away the redundancy of Role Names. You can do so with the Project Team Member Properties.
 -

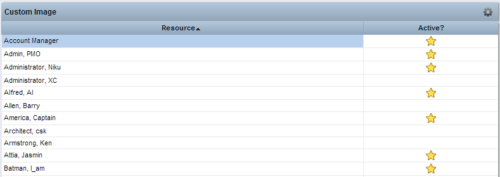 This Tech Trick provides step-by-step instructions for adding images into Clarity v13+ for use in portlets.
 -
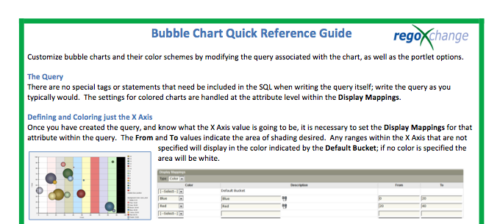 The Bubble Chart Quick Reference Guide provides the user instructions to customize bubble charts and their color schemes by modifying the query associated with the chart, as well as the portlet options. This is very beneficial as it allows the user to match or blend colors among all of the bubble portlets to better display the information the portlets are delivering. Similar data can be one color while different data can be its own color to better show the overall picture.
 -
The Bubble Chart Quick Reference Guide provides the user instructions to customize bubble charts and their color schemes by modifying the query associated with the chart, as well as the portlet options. This is very beneficial as it allows the user to match or blend colors among all of the bubble portlets to better display the information the portlets are delivering. Similar data can be one color while different data can be its own color to better show the overall picture.


Copyright 2023 • Rego Consulting Corporation • Privacy Policy