-
 Hierarchies and Roadmaps are two powerful capabilities that Clarity has brought to the market. While they work great independently, have you experimented with how they can work even better together? In this session, come and learn how these two capabilities can complement each other by working in concert giving you both planning and execution insights!
 -
 Join this session for best practices in optimizing Clarity's Modern UX modules. Learn how - and when - to use specific modules in Clarity (roadmaps vs hierarchies, CITs vs Projects, etc.). Let’s really dive into the power and adaptability of Modern UX features, through the lens of finding the best fit to meet the needs of your end users and business processes.
 -
 Does your organization struggle with resource management? Have you considered creating a Resource Management Office (RMO)? Do you struggle with a lack of executive sponsorship to drive adoption? This session will review how some organizations are succeeding in driving adoption and effectively managing resources by engaging leadership, RMOs, and utilizing more dedicated resources. Learn best practices for driving effective resource management across your organization.
 -
 Are you struggling to come up with a visualization strategy with all of the options available - widgets, portlets, Jaspersoft, Ad Hoc, etc.? This class will explore the various visualization tools available in Clarity and help you understand the best way to output your data. We will provide use cases and examples to assist you in developing a strategy for your organization.
 -
 Aligning work to organizational strategy is a fundamental requirement in today's ever-changing marketplace. High performing organizations are moving beyond basic connections to introduce strategic hierarchies that are tied to real measurements of business value via Clarity's Objectives and Key Results (OKRs). Join our expert guides as they present key concepts, best practices, and the evolution of strategic alignment.
 -
 This course will introduce fundamental programming concepts like variable assignment, conditional statements, and loops. The class will be taught in GEL and will build a solid foundation for future programming skills.
 -
 Just getting started with Clarity Studio? Join us to learn how to create new objects, CITs, attributes, and lookups in your Clarity environment.
 -
 This course will focus on the financial setup and processing in Clarity. We'll discuss topics such as financial entities, fiscal periods, financial attributes, and how they all tie back to a labor rate matrix. These components are crucial for calculating labor costs within Clarity and enabling project managers to make financially sound decisions.
 -
 Join us for a round table discussion on advanced SQL. We'll discuss sub-queries, common table expressions (CTE's), analytic functions, and any other requested topics. With multiple instructors we can break out into smaller groups for a more targeted experience.
 -
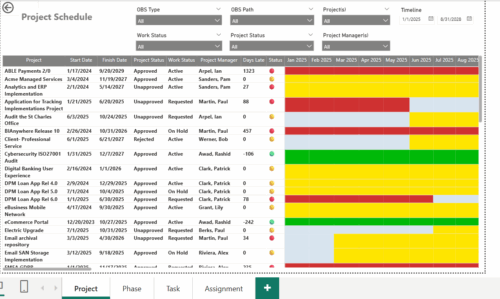 The Project Schedule report provides visibility into project schedule, including detailed information on days late, status and its associated items such as detailed info of schedule on Phase level, Task level and assignment level. Results are grouped by project in Phase, Task and assignment sections or can be viewed without grouping to support flexible analysis for projects. Interactive visuals make it easy to track, monitor, and manage schedule across projects.
 -
 The Financial Budget vs. Forecast by Period report provides insight into financial performance by comparing planned or budgeted costs against forecasted costs across defined time periods. It highlights period-level and total variances to help identify trends and deviations. Results can be grouped by up to two financial attributes, such as Charge Code, Cost Type, Department, Input Type, Location, Resource, Resource Class, Role, Transaction Class, or User Values 1 and 2, allowing flexible analysis by key dimensions.
 -
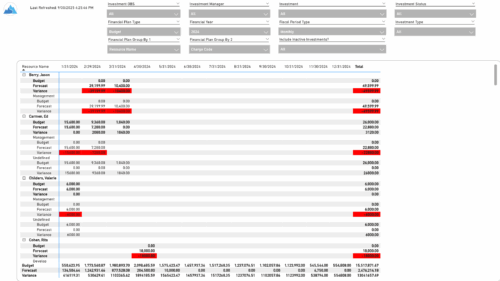
 The Financial Budget vs. Forecast by Period Detail report provides a detailed breakdown of planned or budgeted costs compared to forecasted costs by investment. It displays variances for each period and in total. Users can filter or drill down to view the specific investments that contribute to selected financial plan groupings.


Copyright 2023 • Rego Consulting Corporation • Privacy Policy