
- Why Are We Here
- Value Stream Management
- Simplify Annual Planning
- Monitor Throughout the Year
- Real Product Management
-
 A presentation slide deck from Rego University 2022. A review of Broadcom’s journey to VSM.
 -
 A presentation slide deck from Rego University 2022. Document used in Broadcom’s presentation on Value Steam Metrics.
- Steering the Business with Metrics
- Executive Strategy
- Metrics Approach
-
 A presentation slide deck from Rego University 2022. Document used for Broadcom’s presentation on Collaborative Work Management.
- Real Life Stories – Why this is so important
- Overview and Latest Enhancements
- Demonstration and Use Cases
-
 A presentation slide deck from Rego University 2022. A course outline that reviews the reasons for integrating with Clarity and how to do them well.
- Why integrate?
- Integration Options
- Most Common Integrations
- Lessons Learned
-
 A presentation slide deck from Rego University 2022. An introduction to the use of Jaspersoft Ad Hoc for reporting in Clarity.
- Introduction
- Configuration Basics
- Security Basics
- Installing Jaspersoft Studio
- Interface Introduction
- Data Adapter Setup
- Server Connection Setup
-
 A presentation slide deck from Rego University 2022. This document reviews the model for using Clarity and an Agile tool in a Bi-Modal fashion to improve data and reporting.
- Agile Journey
- Bi-Modal – what is it really and why is it important?
- Value of getting everything together: Planning to Execution
- How to Integrate
-
 A presentation slide deck from Rego University 2022. This document was used to facilitate a discussion and training around creativity in the workplace.
- What is Creativity?
- Why do we care about Creativity?
- Our personality types and behaviors
- Types of Thinking
- Using some tools
-
 A presentation slide deck from Rego University 2022. The document covers Doing Agile, Agile Manifesto and then Being Agile.
 -
 A presentation slide deck from Rego University 2022. This is a document used to moderate a round table discussion at Rego U.
- What are the Agile Buzz-words and what do they mean?
- Are the Scrum Master and Product Owner roles really full-time?
- Do we need PMs when moving to Agile?
- What’s the role of a Business Analysist in Agile?
- How do you manage a PPM portfolio with Agile teams?
- How do you know when it’s time to “go off-script?”
-
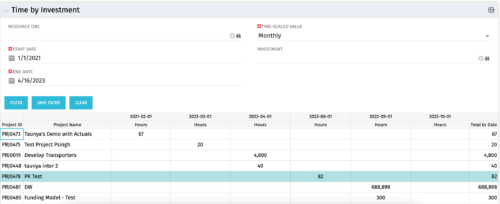 The Time by Investment portlet displays time logged to investments for all investments the logged in user has security rights to view using data from timeslices. It is capable of displaying the data by annual, quarterly, monthly, weekly, and daily segments with totals per date also being presented. The portlet may can be filtered by investment, resource OBS, and time segments. This portlet can be used as a management and governance tool to review aggregate hours posted to investments by time period.
 -
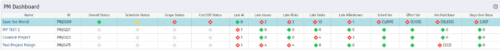 The PM Dashboard portlet provides an overview of all projects for which the user is the Project Manager without navigating to and opening each project individually. All critical information related to the project status is displayed in this portlet. Status indicators display the project’s statuses. Graphical stoplights and numbers provide an overview of all late Action items, Issues, Risks, Tasks, and Milestones.
 -
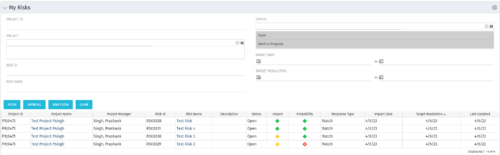 The My Risks portlet displays all risks related to active projects that the logged in user has been assigned as the owner. The portlet provides the logged in user a single place to view risks across multiple projects without having to go into each project individually. The filter then allows the user to narrow their search by Risk ID, Risk Name, Project ID, Project Name, and Risk Status. You may also narrow the view to display issues with a target resolution date or impact date within a certain date range.
 -
The My Risks portlet displays all risks related to active projects that the logged in user has been assigned as the owner. The portlet provides the logged in user a single place to view risks across multiple projects without having to go into each project individually. The filter then allows the user to narrow their search by Risk ID, Risk Name, Project ID, Project Name, and Risk Status. You may also narrow the view to display issues with a target resolution date or impact date within a certain date range.
-
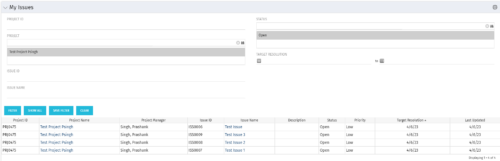 The My Issues portlet displays all issues within active project that the logged in user is assigned to. The portlet provides the logged in user a single place to view issues across multiple projects without having to go into each project individually. The filter then allows the user to narrow their search by Issue ID, Issue Name, Project ID, Project Name, and Issue Status. You may also narrow the view to display issues with a target resolution date within a certain date range.
 -
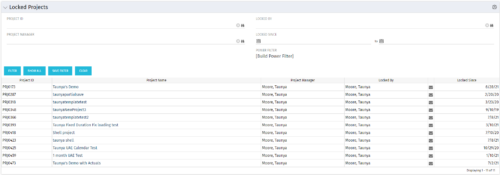 The Locked Projects portlet displays all of the projects in the system that are currently in a ‘locked’ state. The user may view the project ID, Project Name, Project Manager, the user who locked the project, the user's email address, and the date the project was locked. Administrators may utilize the data in this portlet in order to determine if a manual unlock should be executed on a project that has been locked for an extended period of time. Extended locks may indicate the individual has forgotten that he or she had obtained the lock. The portlet includes a hyperlink on the Project Name field, which will allow the administrator to more easily access and unlock the project as well as an email link to mail the user who locked the project.
 -
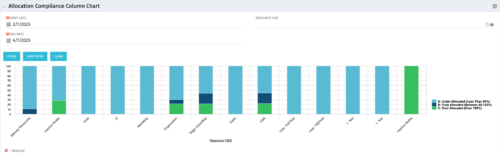 This view depicts Allocation Compliance for resources grouped by OBS. Using the daily Resource Availability and Daily Resource Allocation Time Slices this column chart groups aggregate Allocation vs Availability by OBS Unit. The chart allows quick analysis to see if resources are adequately allocated (between 80% to 120% of their capacity) or if they are significantly under or over allocated. NOTE: The grouping of OBS unit is limited to 1 level below the selected OBS in the portlet filter.
 -
 The All Issues portlet displays all Issues related to active projects that the logged in user has view rights to. The portlet provides the project manager a single place to view issues across multiple projects without having to go into each project individually, and allows for more efficient management and reporting across projects. The filter then allows the user to narrow their search by Issue ID, Issue Name, Project ID, Project Name, the individual to whom the issue is assigned, and Issue Status. You may also narrow the view to display issues with a target resolution date within a certain date range, or Issues associated with a particular Category or OBS unit. Note: Only the projects that the user has viewer rights to will show up in the list.
 -
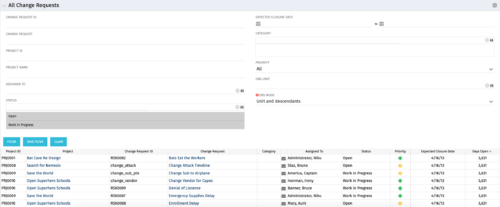 The All Change Request portlet displays all change requests related to active projects that the logged in user has view rights to. The portlet provides the project manager a single place to view change requests across multiple projects without having to go into each project individually and allows for more efficient management and reporting across projects. The filter allows the user to narrow their search by date ranges, resources involved, and/or the project with which the Change Request is associated. Other alternatives for filtering include the category, priority or status of the Change Request. In the list view, a status is displayed for each Change Request (CR), along with the Project with which the CR is associated, the CR ID, the CR name, the resource to whom the CR is assigned, Priority, Expected Closure Date, and number of days the CR has remained open. Note: Only the projects that the user has viewer rights to will show up in the list.
