-
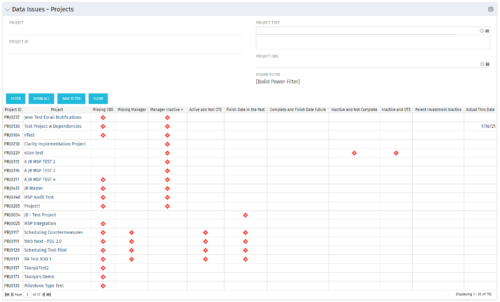 The Project Data Issues portlet is used to identify data exceptions related to project setup. This portlet helps to identify where projects are missing key data or are possibly sitting in an exception state. This view will show projects that have one or many exceptions, including inactive projects. The user may also narrow the results by project, OBS, or project type.
 -
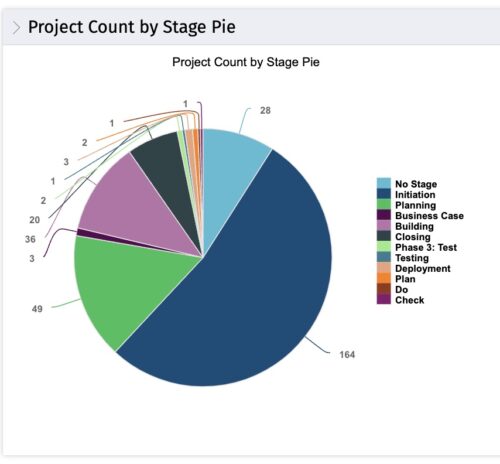 This portlet displays the projects by Stage in a pie chart. Every piece of the pie chart represents a stage of the Project Management methodology applied. The portlet also shows the number of projects on each stage. The legend displays all the different project stages appearing on the portlet. This portlet can be filtered to show only projects from a particular OBS unit or for a particular Project Manager.
 -
This portlet displays the projects by Stage in a pie chart. Every piece of the pie chart represents a stage of the Project Management methodology applied. The portlet also shows the number of projects on each stage. The legend displays all the different project stages appearing on the portlet. This portlet can be filtered to show only projects from a particular OBS unit or for a particular Project Manager.
-
 Part of the Business Transformation collection, this bar-chart portlet displays number of investments per stage. This provides a holistic overview of where the projects are within the organization.
 -
Part of the Business Transformation collection, this bar-chart portlet displays number of investments per stage. This provides a holistic overview of where the projects are within the organization.
-
Part of the Business Transformation collection, this bar-chart portlet displays number of investments per stage. This provides a holistic overview of where the projects are within the organization.
-

 The portlet shows the project spend to vendors by month. The Vendor field picked on the portlet comes from the Vendor mentioned when creating the voucher (as displayed on the first screenshot). This provides a nice view of identifying how much is spent by an organization on the vendor employees on their workforce.
 -
The portlet shows the project spend to vendors by month. The Vendor field picked on the portlet comes from the Vendor mentioned when creating the voucher (as displayed on the first screenshot). This provides a nice view of identifying how much is spent by an organization on the vendor employees on their workforce.
-
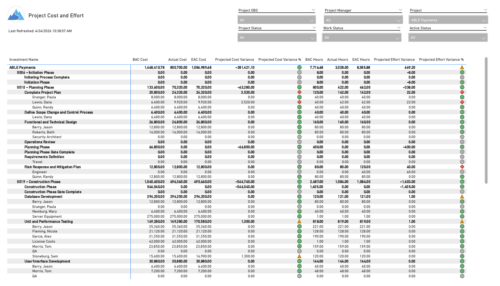 The Project Cost and Effort report provides a structured view of project financials and effort by outlining the work breakdown hierarchy, including any related subprojects. Users can choose to display information at varying levels of detail, such as project, phase, task, or assignment, depending on reporting needs. The report includes key metrics like baseline values, actuals, estimates at completion, and projected variances for both cost and effort. This enables stakeholders to analyze performance, monitor spending and workload, and gain insight into how projects are tracking against expectations.
 -
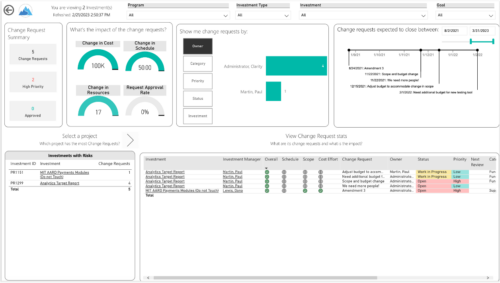
 Gain an overview of program-level performance, track program milestones, and assess overall program health. Report Views include:
- Change Requests
- Program Costs Trend
- Program Costs
- Program Drill Thru
- Program Effort
- Program Gantt
- Program Issues
- Program Milestones
- Program Risks
- Program Staff
- Program Status Reports
- Program Summary
- Program Tasks


Copyright 2023 • Rego Consulting Corporation • Privacy Policy