-
 Part of the Business Transformation Collection, this bubble-chart portlet displays investments per their alignment, status and total planned benefit. The: X-axis displays the alignment Y-axis displays the status Bubble-size displays the total planned benefit
 -
Part of the Business Transformation Collection, this bubble-chart portlet displays investments per their alignment, status and total planned benefit. The: X-axis displays the alignment Y-axis displays the status Bubble-size displays the total planned benefit
-
Part of the Business Transformation Collection, this bubble-chart portlet displays investments per their alignment, status and total planned benefit. The: X-axis displays the alignment Y-axis displays the status Bubble-size displays the total planned benefit
-
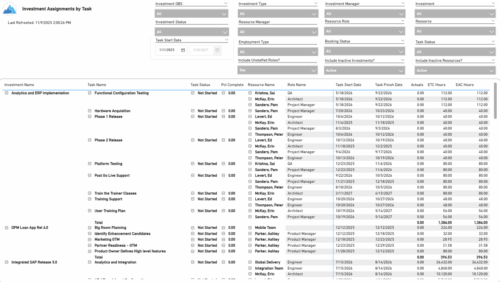 The Investment Assignments by Task report provides a detailed breakdown of effort at the task-assignment level for each investment. It displays both actuals and estimates for resource assignments, along with task status, percent complete, and assignment start and finish dates. Totals are available at the investment level, making it easy to analyze workload, progress, and effort distribution across tasks and resources.
 -
 The Investment Baseline vs. Plan by Task report offers an in-depth view of how resource and role allocations align with original plans. It breaks down key metrics such as baseline, actuals, remaining effort, projected totals, and variances across a rolling 12-month period based on the selected start date. Data is presented both monthly and cumulatively for each investment and assignment, with the flexibility to view values in hours or FTEs. This report helps stakeholders assess performance, identify gaps between planned and actual work, and better understand resource utilization trends.
 -
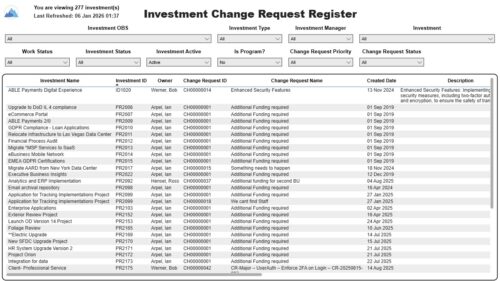 The Investment Change Request Register report displays comprehensive information for each investment change request. The report only includes investments where the Risk, Issues and Change modules are available. Report Prerequisites Verify that you have completed the following prerequisites before you run this report: • The investment must have at least one change request for the project to display in the report. • The change request properties must have fields such as description, change in cost, change in schedule, change in resources, category, expected close, approved by, approved date, and originating ID completed for them to display data in the report. The change request name, change request ID, priority, status, and owner are required in Classic PPM so they always display data. • The Load Data Warehouse job must be run before you run this report. If the Data Warehouse is not populated, the report will not display any data. Also, most of the report parameters do not display options.
 -
 The Investment Issue Register report displays comprehensive information for each investment issue. The report only includes investments where the Risk, Issues, and Change modules are available. Report Prerequisites Verify that you have completed the following prerequisites before you run this report: • The investment must have at least one issue for the project to display in the report. • The issue properties must have fields such as description, category, resolution, target resolution, impact date, and originating ID completed for them to display data in the report. The issue name, issue ID, priority, status, and owner are required in Classic PPM so they always display data. • The Load Data Warehouse job must be run before you run this report. If the Data Warehouse is not populated, the report will not display any data. Also, most of the report parameters do not display options.
 -
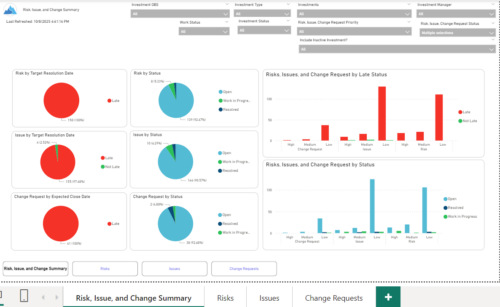 The Investment Risk, Issue, and Change Summary report delivers a consolidated view of overall project health through analytical visualization of risks, issues, and change requests. The report incorporates interactive pie chart representations to monitor item distribution by target resolution date, expected closure date, and current status, enabling efficient trend analysis and decision-making. A detailed transactional data table provides comprehensive visibility into each record, including item name, unique identifier, priority, status, category, ownership, creation date, and projected or actual resolution/closure dates. Additionally, the report supports dynamic grouping by project or ungrouped analysis, allowing stakeholders to perform flexible cross-project monitoring, operational tracking, and performance assessment.
 -
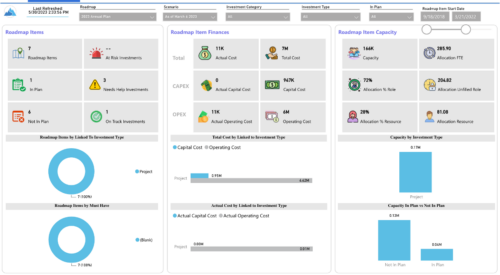
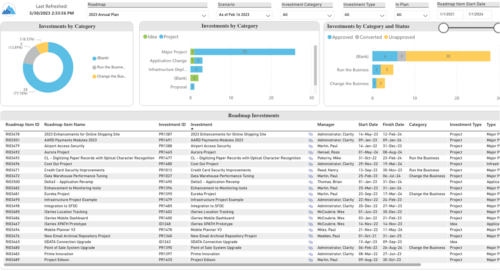 Plan your future work by comparing different scenarios, including in-flight work, and determine the best course of action for your organization. Report Views include: • Roadmap Details • Resource Investment Demand • Roadmap Financials • Roadmap Investment Gantt • Roadmap Item Gantt • Roadmap Overview – Default Scenarios • Roadmap Overview – Single Roadmap Selection • Scenario Comparison Demo Video - https://www.youtube.com/watch?v=RjdvrRd4ZG0&list=PLXJ5ktuWV0jiS9CvBpHvBIwpKPmA9uvwK&index=7
 -
 Plan your future work by comparing different scenarios, including in-flight work, and determine the best course of action for your organization. Report Views include:
- Roadmap Details
- Resource Investment Demand
- Roadmap Financials
- Roadmap Investment Gantt
- Roadmap Item Gantt
- Roadmap Overview – Default Scenarios
- Roadmap Overview – Single Roadmap Selection
- Scenario Comparison
-
 A presentation slide deck from Rego University 2022. A review of the best practices in IT Planning from an Apptio perspective.
- Custom layouts
- Bookmarks
- Dropdown and autofill
- Cost object permissions
- Dashboard reports
- Targets
- Change history / Event Log
- Data input enforcement
- Managing archive
- Stay on top of product updates
-
 Course Description: Do you know what PPM, APM, Agile, ITFM, and other tools are available in the marketplace? Have you taken a strategic look at the key IT processes and tools that exist to support them? Have you been asked to evaluate and recommend a PPM tool? This class will review other ITBM tools and examine their pros and cons. We will also provide six keys to evaluating a PPM solution.


Copyright 2023 • Rego Consulting Corporation • Privacy Policy