-
 This training document is a Rego Consulting Quick Reference Guide to assist with Time Entry Administration Settings for Timesheets. This doc references version 16.0.3 views. Document provides detail on Timesheet Options for the Modern UX and how to enable end user column configuration. Detail is also provided on how end users may configure their timesheet view.
 -
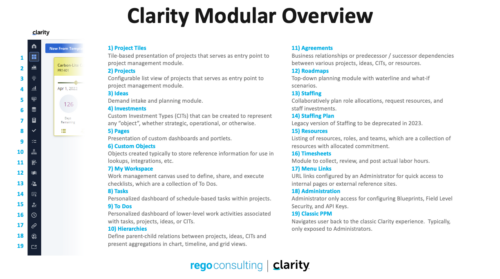 A quick reference guide that reviews all of the icons used in the vertical menu bar and provides a quick explanation on their meaning/use.
 -
A Rego produced document that shows the stock reports and views in Clarity. Also includes views of Power BI reports available in RegoXchange. 193 pages.
-
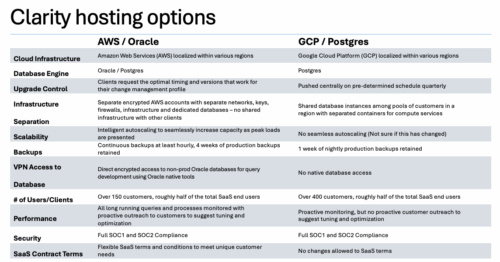

A one page comparison of of the two Clarity SaaS platforms. Broadcom's GCP vs the Rego AWS hosting platforms. Compares Cloud Infrastructure, Database Engine, Upgrade Control, Scalability, Performance and more.
-
 A Quick Reference Guide to assist in creating or adding Calculated Fields or Measures to a Jaspersoft Report. Calculated Fields or Measures can be created and added to a new or existing Ad-Hoc view by applying formulas to the measures.
 -
 A Quick Reference Guide to assist in the process of adding filtering for the data to be presented in a Jaspersoft Report. If a report output contains more information than desired, Jaspersoft Reporting provides an interactive filtering capability so only the necessary data is displayed. The filtering conditions can include fields, numbers, dates and text. Filters can be added to reports as they are being created or adding to saved views. Filters cannot be added to a Report.
 -
 XOG & Query Bridge (XQ) is a 2-in-1 Clarity PPM toolset that provides enhanced functionality and an improved user experience when retrieving and inserting data to/from Clarity PPM environments. XQ is available as a Web-based application and also as a downloadable desktop version that supports both On-premise and On-demand Clarity PPM implementations. https://xogbridge.com/
 -
 A Quick Reference Guide with tips on creating a Dashboard in Jaspersoft. The document walks through the steps and uses screenshots to show the process.
 -
 A Quick Reference Guide to assist in the process of creating a chart in Jaspersoft. The guide walks through the steps using screenshots.
 -
 A Quick Reference Guide to assist in the process of creating a crosstab in a Jaspersoft Ad-hoc report. The document uses screenshots to walk you through the process.
 -
 A Quick Reference Guide to assist in the process of creating a table in a Jaspersoft Ad-Hoc Report. Uses screenshots to walk you through the process.
 -
 A Quick Reference Guide to assist in the process of scheduling a Jaspersoft Report to run. Gives you the steps and shows screen shots to assist with the process.


Copyright 2023 • Rego Consulting Corporation • Privacy Policy