-
 This training document is a Rego Consulting Quick Reference Guide to assist with Financial Actuals and Reporting in Clarity’s Modern User Experience. This doc references version 16.0.3 views. Document includes detail on which jobs should be run to ensure project and financial data is synchronized with the latest posted actuals. Information is provided on how to analyze cost plans and how to review actual transactions. Instructions are provided on how to analyze budget plans.
 -
 This training document is a Rego Consulting Quick Reference Guide to assist with the management of the Card View within Hierarchies in Clarity’s Modern User Experience. This doc references version 16.0.3 views. Document provides detail on View Options, Color By, Card Fields and Card Metrics. Information on how to roll up metrics via an aggregation or calculation method.
 -
 This training document is a Rego Consulting Quick Reference Guide to assist with the creation of Hierarchies in Clarity’s Modern User Experience. This doc references version 16.0.3 views. Document provides information on how to import investments and how to create child / parent relationships. Detail is provided with regard to the export of Hierarchies to PDF format.
 -
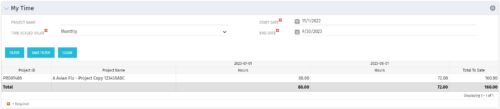 The My Time portlet provides the logged in user with the ability to view his or her time by project by time period without having to go into each period individually on the Timesheets page. This portlet uses the actual timeslices to retrieve data. It displays the amount of time worked per week, month or quarter on projects. The user may specify the dates, time-scaled value and the project name. The portlet also provides a Total to Date, which shows the total number of actuals for that resource on that assignment.
 -
The My Time portlet provides the logged in user with the ability to view his or her time by project by time period without having to go into each period individually on the Timesheets page. This portlet uses the actual timeslices to retrieve data. It displays the amount of time worked per week, month or quarter on projects. The user may specify the dates, time-scaled value and the project name. The portlet also provides a Total to Date, which shows the total number of actuals for that resource on that assignment.
-
 Part of the Business Transformation collection, this grid portlet displays idea details for all ideas (active and inactive) and all status conditions. This is an editable portlet based on the Ideas data provider. Filterable by OBS structure, Active/Inactive, and Status.
 -
 A Quick Reference Guide to assist in the process of creating a table in a Jaspersoft Ad-Hoc Report. Uses screenshots to walk you through the process.
 -
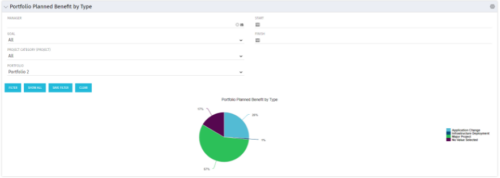 Part of the Business Transformation collection, this pie chart portlet displays realized benefit, grouped by type of project, for portfolio investments. It uses System Provider: Portfolio Investment Provider.
 -
 Horizontal Bar Graph displays total number of projects for each Business Owner/Sponsor for a selected Project Parent Stage (only Project Investments included). Vertical Axis displays Business Owner name. Horizontal Axis displays number of projects. Filter selectable for any Project Parent Stage. Color coding of bar and legend are synchronized to detail stage under the parent. Total for each detail stage displays on each segment of the bar. A mouseover displays a percent of total for each detail stage.
 -
 A Quick Reference Guide to assist in entering financial transactions into Clarity’s Classic UX. The guide reviews the basics of transactions entry, create voucher header, entering the line item - details, and entering the line item - transaction.
 -
 Part of the Business Transformation Content collection, this bar chart portlet displays count of ideas per business unit. This provides a holistic view of the idea pipe-line in an organization providing them a high-level of ideas converted, approved, unapproved per business unit.
 -
 Part of the Business Transformation collection, this pie chart portlet displays realized benefit, grouped by category for portfolio investments. It uses System Provider: Portfolio Investment Provider.


Copyright 2023 • Rego Consulting Corporation • Privacy Policy