-
 A .pdf file that has the slide by slide presentation at 2015 RegoU on how other companies are using CA PPM. The agenda covers an overview, definitions, business value, key requirements and best practices.
 -
 ** No Download - Do not Add to Cart ** KPIs and metrics have been around forever. With the prevalence of Agile integrations and an increased focus on business value, it is time for a reimagining of progress and success measurements in Clarity. In this webinar, Rego expert guides Alyson Poston and Wes McCoubrie will discuss the following: - Metrics you should monitor beyond the traditional Scope, Schedule, Cost and Effort. - Key Agile data you should incorporate into your metrics. - Today’s critical business metrics and key results (OKRs) to track. - What comes out-of-the-box with Clarity, and of those, which ones does Rego recommend you introduce into your organization. ** No Download ** follow this link to sign up to view the recorded webinar - http://info.regoconsulting.com/clarity-kpis-and-metrics-march-2021
 -
 Effective resource management is vital for delivering successful and profitable projects. Get it right and costs will be controlled, objectives achieved, and deadlines met. Get it wrong and we run the risk of not just project timescales slipping but also margins and competitive advantages eroding. This paper looks at resource management best practices and how we can adopt practices to increase project quality, agility, and efficiency. This White Paper is downloaded from the Rego Consulting site. You will be asked to provide your email address and current ppm tool. - http://info.regoconsulting.com/smarter-resource-mgmt-whitepaper ** No Download - Do not Add to Cart **
 -
 Rego’s training materials for Managing Portfolios in Clarity. The slide deck was put together using Clarity version 15.4.1. This course will describe how to:
- Organize Portfolios
- Define Portfolio Properties
- Build Portfolio Contents and Synchronization
- Define Portfolio Targets
- Utilize the Portfolio Waterline
- Ranking Investments
- Scenario Planning
- Portfolio Analysis and Outputs
-
 Rego’s training materials on Clarity PPM Financials. This slide deck in based on the classic version of Clarity v15.4.1. Course materials start with an introduction, move to Cost Plans, Budget Plans and then finish with Reporting of Financial Data. There is also an appendix of supporting information.
 -
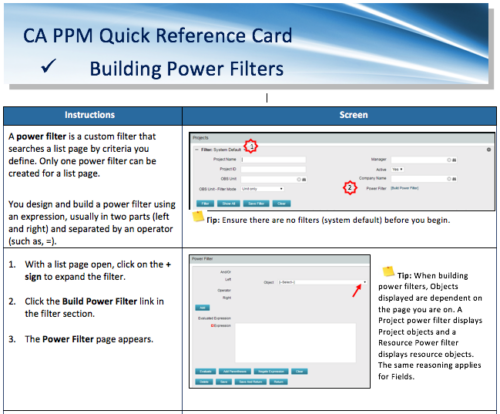 A Quick Reference Card to assist in the building of Power Filters in CA PPM. A power filter is a custom filter that searches a list page by criteria you define. Only one power filter can be created for a list page.
 -
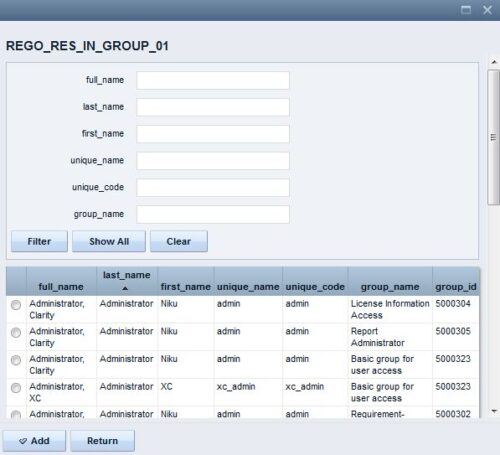 The Resource Lookups in a Group technical trick provides step-by-step instructions on creating a resource lookup based on members of a particular security group. For some fields, you want to narrow the amount of resources that the resource browse window supplies. By adding the selected users to a specific security group, the administrator may only display those resources in a resource browse window on the application side.
 -

 The Multi-Value Filter in Query-Based technical trick document provides an overview of how to create a multi-value lookup in a portlet filter, where the field is a parameter within the query. If the query imbeds the parameter normally, the portlet will only be able to have a single selection of that parameter. This technical solution will enable you to make these parameters multi-selects.
 -
 Course description: “Are you struggling with deploying Jaspersoft reports between environments? This class will walk through the process and provide some tips and tricks from the experts.” Download file is the slide deck used during the presentation.
 -
- Introduction to Power BI and its components
- Getting Data
- Mockup – PM and RM Dashboard
- Publishing and Sharing
- Best practices and its limitations
- Tableau Introduction
-
 Are you starting a resource management implementation, or do you want to compare how you are using these functions vs. others or best practices? In this class we will discuss some best practices from successful customers.
 -
 Do you want to understand the OOTB configuration and functionality of financial management? In this class, we will review the OOTB objects, views, views, and functions of financial plans, rates, and other related areas. We will cover both classic and new UX highlighting differences.


Copyright 2023 • Rego Consulting Corporation • Privacy Policy