-
 An updated version of our training material for Jaspersoft Ad-Hoc Reporting for Clarity. Introduces Jaspersoft as a reporting tool, explains security, the data warehouse, and JS Domains. Then delves into navigation, running a report, creating an ad-hoc report, saving it, creating a cross tab report, creating a chart, creating a dashboard, and scheduling the report.
 -
 A Quick Reference Guide to assist in the process of creating a crosstab in a Jaspersoft Ad-hoc report. The document uses screenshots to walk you through the process.
 -
 A Quick Reference Guide to assist in the process of creating a chart in Jaspersoft. The guide walks through the steps using screenshots.
 -
 A Quick Reference Guide to assist in creating or adding Calculated Fields or Measures to a Jaspersoft Report. Calculated Fields or Measures can be created and added to a new or existing Ad-Hoc view by applying formulas to the measures.
 -
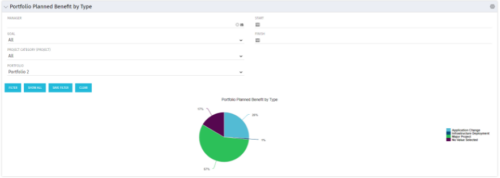 Part of the Business Transformation collection, this pie chart portlet displays realized benefit, grouped by type of project, for portfolio investments. It uses System Provider: Portfolio Investment Provider.
 -
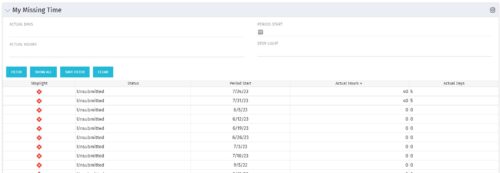 The My Missing Time portlet displays all open time periods for which the logged in user (assuming they are open for time entry with a track mode of Clarity) has a timesheet that is not posted (accommodates for hire and termination dates). The portlet is used as a quick reference for users to view their missing time.
 -
 Part of the Business Transformation Collection, this bubble-chart portlet displays investments per their alignment, status and total planned benefit. The: X-axis displays the alignment Y-axis displays the status Bubble-size displays the total planned benefit
 -
Part of the Business Transformation Collection, this bubble-chart portlet displays investments per their alignment, status and total planned benefit. The: X-axis displays the alignment Y-axis displays the status Bubble-size displays the total planned benefit
-
 Part of the Business Transformation collection, this pie chart portlet displays realized benefit, grouped by category for portfolio investments. It uses System Provider: Portfolio Investment Provider.
 -
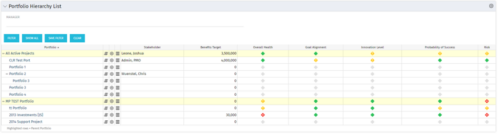 Part of the Business Transformation Package, this portlet displays the portfolios with hierarchy (child portfolio(s)). The portlet displays the basic portfolio fields like – manager, stakeholder, etc. A Metrics subpage can be created with the fields on the “Properties – Metrics.”. The fields: Overall Health, Goal Alignment, Innovation Level, Probability of Success are custom fields and can be configured on a subpage.
 -
 Join Rego’s senior Agile guides and learn best-practice usage patterns to support your ART-level practices with Rally Software. We’ll explore all the ceremonies in a team-of-team (ART) program increment and how you can use Rally to align, simplify, and leverage for scaled delivery of high-value solutions.
 -
 Apptio can be used for so much more than App TCO and Service Costing. Let's talk about valuable non-traditional use cases you might want to consider exploring.


Copyright 2023 • Rego Consulting Corporation • Privacy Policy