-
 Learn basic administrative tasks in this basic administration Clarity training, which includes setting up resources, security groups, OBSs, lookups, time reporting periods, fiscal time periods, calendars, jobs, and timeslices. These activities are focused on ongoing support vs. new configuration. Learn how to setup the ModernUX
 -
 Hierarchies and Roadmaps are two powerful capabilities that Clarity has brought to the market. While they work great independently, have you experimented with how they can work together, even better? In this session, come and learn how these two capabilities can complement each other by working in concert giving you both planning and execution insights!
 -
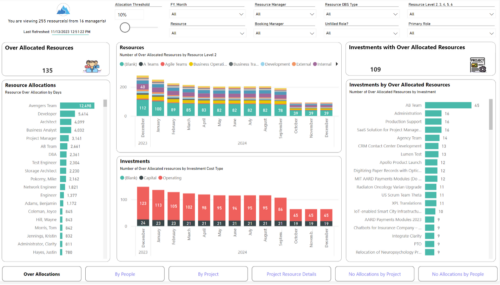 Evaluate resource allocations, identify bottlenecks, and ensure optimal resource utilization across projects and teams. Report Views include: • Over Allocation • By Project • By People • Project Resource Details • No Allocations by Project • No Allocations by People The main file will access data through custom queries created via Rego Odata connector.
 -
 Learn advanced administrative development tasks—including Objects and Fields, Object Portlets, Basic Processes, and XOG. In the last portion of this class we will walk through the high level data model within the Clarity database and walk through some basic NSQL portlets. This is a more technical class focusing on basic configurations - designed for non-technical people.
 -

Rego’s Clarity Adoption Metrics package consists of two sets of metrics: Project metrics, and Resource metrics. Project metrics measure how effectively project managers are using Clarity to manage their projects. Resource metrics measure how effectively resource managers are using Clarity to manage resources. Metrics are scored on a scale of 0 to 5, with higher scores indicating greater adoption and use. All metrics can be viewed numerically or graphically, and can be broken out by OBS. In addition, metric data can display as a 12-month rolling history to help identify trends. Project metrics can also display by lowest / highest adoption rates for a specific resource metric or all resource metrics. There is a variety of way to view the Adoption Metric data, therefore, Rego has made this simple by creating an Adoption Metrics object that contains multiple tabs. Each tab displays one or more of the Project or Resource Adoption Metrics. Based on the nature of the Metrics some tabs will allow the ability to use a pull down menu to select a specific Adoption Metric. There is also a Metrics trending view that pulls monthly snapshots of the metrics. Project metrics consist of the following: - Project Status Reporting – Measures how well PMs create and publish project status reports.
- Project Risk Adoption – Measures how well Risks are being used and managed.
- Project Issue Adoption – Measures how well Issues are being used and managed.
- Project Schedule – Measures how well PMs create tasks and keep the project schedule current.
- Project Baseline – Measures whether or not baselines exist.
- Project Zero ETC’s – Measures how well the PM assigns resources to tasks with ETCs.
- Project Past ETC’s – Measures how many improperly scheduled tasks the PM has.
- Project Milestone / Key Tasks – Measures how well PMs create and manage Milestones / Key Tasks.
- Project Schedule Variance – Measures how effectively PMs manage their schedules.
- Project Effort Variance – Measures how effectively PMs manage their project efforts.
- Project Budget Variance – Measures how effectively PMs manage budgets or cost plans.
- Project Unfilled Roles – Measures project roles with allocations that are already started or starting within the next 30 days.
- Project Data Quality – Measures how effectively PMs complete the Description, Stage, Progress, Objective, and Sponsor/Business Owner fields.
- Project Commitment – Measures the hard allocations for a project over a two week time frame.
- Resource Clarity Usage – Measures how often users log into Clarity.
- Resource Timesheet – Measures if timesheets post in a timely manner.
- Resource Allocation – Measures how well RMs keep total resource allocations within the expected range for future time periods.
- Resource Actualy Utilization – Measures how well Resource allocations match actuals.
- Resource Allocation Date in the Past – Measures how many resources are open for time entry with dates in the past.
- Resource Data Quality – Measures how well RMs complete the Resource Manager and Primary Role fields and optionally the Skill and Employment Type fields.
- Resource Commitment – Measures how much resource available time is committed to projects.
-
 This training document is a Rego Consulting Quick Reference Guide to assist with accessing the various project views in Clarity’s Modern User Experience. Reviews the Tile, Grid and Board views for projects.
 -
 A Rego Training deck that reviews the use of Hierarchies in Clarity PPM’s Modern UX.
- Hierarchies in Clarity PPM can be used to create one or more hierarchies that define relationships between various investments. Each hierarchy includes an investment tress card made up of multiple cards.
- A parent-child relationship between investment cards help stakeholders understand the dynamics of the investments. Stakeholders can use the Hierarchies page to view all the hierarchies in the organization.
- Hierarchies can include different investment types such as; ideas, projects, and custom investments with configurable cards by investment type.
- Hierarchies can display rolled up aggregation metrics.
- Hierarchies can be exported to PDF.
-
 This session will aligning you with some of the best and most common practices for using Clarity's Resource Management capabilities. Come and learn about the cababilities that come out of the box for resource insights like allocations, assignments, availability and more. Additionally, tips and tricks will be discussed leaving you with a toolkit of ideas for your organization!
 -
 Are you using Clarity's roadmap leveraging some of the best and most common practices found across industries? Come to this session to learn about how the roadmap works, out of the box. We will cover how to configure views, targets, widgets, boards and more! You will leave with great ideas you can bring back to your organization!
 -

A presentation slide deck from Rego University 2022. This document reviews the best practices for resource management in Clarity. - Implementation
- Availability
- Allocation
- Assignment
- Reporting
- Notification
- Data Maintenance
-
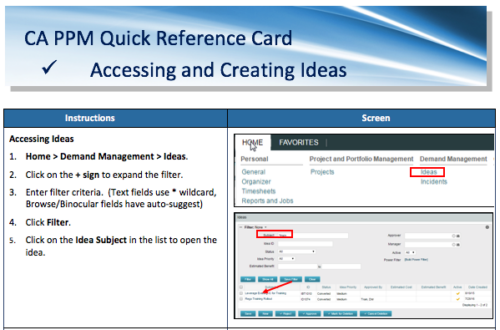 A Quick Reference Card to assist in the creation of Ideas in CA PPM. Ideas are created by going to Home, then Demand Management and choosing Ideas from the list menu.
 -
 What should I expect to see within my organization related to PM over the next couple of years? How should I prepare my PMs, PMOs, or myself to embrace the new trends within the industry. This class will share Rego's observations on industry trends within PPM.


Copyright 2023 • Rego Consulting Corporation • Privacy Policy