-
 Horizontal Bar Graph displays total number of projects for each Business Owner/Sponsor for a selected Project Parent Stage (only Project Investments included). Vertical Axis displays Business Owner name. Horizontal Axis displays number of projects. Filter selectable for any Project Parent Stage. Color coding of bar and legend are synchronized to detail stage under the parent. Total for each detail stage displays on each segment of the bar. A mouseover displays a percent of total for each detail stage.
 -
 Are you considering or analyzing PMO value metrics? This class is a working session will cover lessons learned in PMOs, so you can craft guiding metrics, with or without a tool.
 -
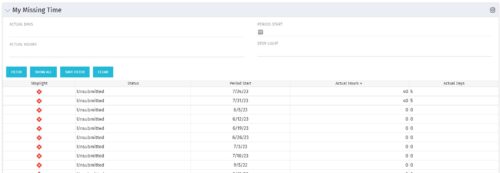 The My Missing Time portlet displays all open time periods for which the logged in user (assuming they are open for time entry with a track mode of Clarity) has a timesheet that is not posted (accommodates for hire and termination dates). The portlet is used as a quick reference for users to view their missing time.
 -
 Part of the Business Transformation Content collection, this bar chart portlet displays count of ideas per business unit. This provides a holistic view of the idea pipe-line in an organization providing them a high-level of ideas converted, approved, unapproved per business unit.
 -
Part of the Business Transformation Content collection, this bar chart portlet displays count of ideas per business unit. This provides a holistic view of the idea pipe-line in an organization providing them a high-level of ideas converted, approved, unapproved per business unit.
-
 Part of the Business Transformation collection, this pie chart portlet displays realized benefit, grouped by category for portfolio investments. It uses System Provider: Portfolio Investment Provider.
 -
 Did you stray from OOTB? Was that the right decision? This will be a discussion on pros and cons of sticking to Clarity’s stock attributes, views, and general capabilities. When does it make sense to avoid custom configuration? Conversely, when does it make sense to move beyond the standard OOTB setup?
 -
 With its end-to-end capabilities and aggregated data, ValueOps is an ideal platform on which to build the ultimate AI for value stream management. In this must-see session, Jean-Louis Vignaud, Head of ValueOps, will outline his vision of how our next generation of AI features will help deliver curated visibility, guided alignment, and augmented efficiency to the enterprise.
 -
 With ValueOps Insights you can gain transparency into full value stream analytics. Come learn about metrics to run your business including flow metrics, DORA, and value realization metrics that give your management team a compass to find the value your teams are delivering.
 -
 Gaining adoption with Clarity can sometimes feel daunting. However, there are some great best practices and lessons learned that drive successful and easy adoption! Come to this session and learn from your peers about better and easier adoption practices. This roundtable will be moderated and give you some great ideas to take home! We will have an expert panel and then divide into small groups to discuss customer selected topics. 100% sharing, 100% learning.
 -
 This quick discussion will highlight tips for ensuring you will get the most out of your Rego University experience. We will discuss how to select classes, meet with peers, and obtain one on one advice over the 3 days of the conference.
 -
 This course will take a deeper dive into Clarity portlets. We'll take the next step after configuring object based portlets, and learn how to write an NSQL query to provide data to your portlet. We'll cover different types of portlets, grids, graphs, and multi-dimensional portlets, demonstrate how to surface the portlet on a page, and channel to it from Modern UX. Including HTML portlets and scripting tips.


Copyright 2023 • Rego Consulting Corporation • Privacy Policy