-
 This training document is a Rego Consulting Quick Reference Guide to assist with the management of project Financials in Clarity’s Modern User Experience. This doc references version 16.0.3 views. Document includes summary information on the Financials module and provides detail on how to customize the grid and save views. Instructions are provided on how to filter data and how to use the ⋮ (vertical ellipses) icon to access further features. Detail is provided on the group by function, the column panel, the export of cost plan and editing cost plan and budget plan data from the grid.
 -
 Part of the Business Transformation collection, this grid portlet displays idea details for all ideas (active and inactive) and all status conditions. This is an editable portlet based on the Ideas data provider. Filterable by OBS structure, Active/Inactive, and Status.
 -
Part of the Business Transformation collection, this grid portlet displays idea details for all ideas (active and inactive) and all status conditions. This is an editable portlet based on the Ideas data provider. Filterable by OBS structure, Active/Inactive, and Status.
-
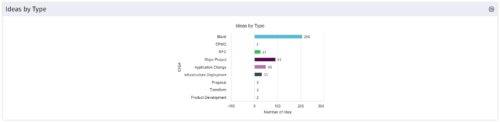 This is a great way to review demand by type and evaluate where demand is coming from and who will be impacted. Displays a bar graph of all ideas group by type.
 -
This is a great way to review demand by type and evaluate where demand is coming from and who will be impacted. Displays a bar graph of all ideas group by type.
-
 Looking for metrics that you can implement immediately in CA PPM? This class will be a working session to review all of the content available out of the box and within the CA and Rego content packs. This will provide you the options for metrics the represent industry best practice without the costs to develop them.
 -
 A Quick Reference Guide to assist in the process of running a Jaspersoft Report. Guide walks through the steps and has screen shots to assist in the process.
 -
 A Quick Reference Guide to assist in the process of scheduling a Jaspersoft Report to run. Gives you the steps and shows screen shots to assist with the process.
 -
 A Quick Reference Guide to assist in the process of adding filtering for the data to be presented in a Jaspersoft Report. If a report output contains more information than desired, Jaspersoft Reporting provides an interactive filtering capability so only the necessary data is displayed. The filtering conditions can include fields, numbers, dates and text. Filters can be added to reports as they are being created or adding to saved views. Filters cannot be added to a Report.
 -
 This training document is a Rego Consulting Quick Reference Guide to assist with Time Entry Administration Settings for Timesheets. This doc references version 16.0.3 views. Document provides detail on Timesheet Options for the Modern UX and how to enable end user column configuration. Detail is also provided on how end users may configure their timesheet view.
 -
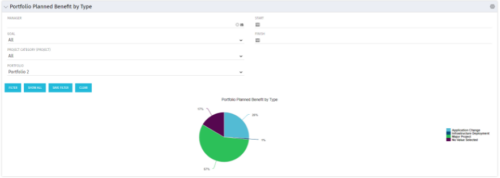 Part of the Business Transformation collection, this pie chart portlet displays realized benefit, grouped by type of project, for portfolio investments. It uses System Provider: Portfolio Investment Provider.
 -
 Horizontal Bar Graph displays total number of projects for each Business Owner/Sponsor for a selected Project Parent Stage (only Project Investments included). Vertical Axis displays Business Owner name. Horizontal Axis displays number of projects. Filter selectable for any Project Parent Stage. Color coding of bar and legend are synchronized to detail stage under the parent. Total for each detail stage displays on each segment of the bar. A mouseover displays a percent of total for each detail stage.


Copyright 2023 • Rego Consulting Corporation • Privacy Policy