-
 This training document is a Rego Consulting Quick Reference Guide to assist with the creation and editing of Tasks in the Timeline View of Clarity’s Modern User Experience. This doc references version 16.0.2 views. Doc covers how to create a new task in the Timeline View, how to insert sibling or insert child tasks, how to set Milestones, access the Details pane and add resource Assignments. Also details how to move tasks by clicking and dragging within the Timeline View.
 -
 This training document is a Rego Consulting Quick Reference Guide to assist in the replacement of roles with named resources in Clarity’s Modern User Experience. This doc references version 16.0.2 views. Document provides detail on soft bookings, default allocation and requested manager. Instructions are provided on how to access requests from the Staffing Plan view and how to swap the role for a named resource. If requests are not fulfilled in their entirety, details are provided on how the excess allocation is handled.
 -
 A Quick Reference Guide to assist in creating a Cost Plan in an Idea within Clarity. Shows the process in Clarity’s Classic UX with the Phoenix theme applied.
 -
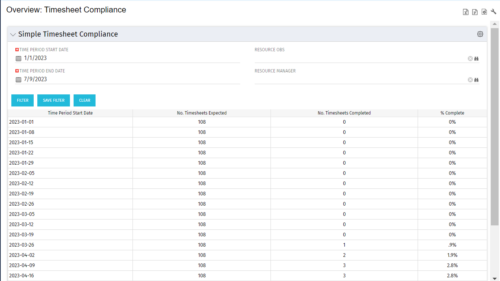 This portlet provides a view into the number of timesheets that were expected to be completed for a specified time period(s) as well as the number of timesheets that were completed and the percent complete. This can also be filtered by OBS so that a company can see timesheet compliance at the OBS level.
 -
 The Clarity Health portlet provides a quick glance into the health of key components and critical jobs in the Clarity environment. The following metrics are monitored: Process Engine Heartbeat should refresh itself every 10 minutes. Process Engine is responsible for the triggering of processes. Green <= 10 Minutes, Yellow 11-15 Minutes, Red > 15 Minutes Time Slices Time Slices are required for accurate reporting. Best practice is for the Time Slicing job to run every minute. Please note there are some jobs that will cause the time slicing to delay so a momentary delay is normal. Green <= 10 Minutes, Yellow 11-15 Minutes, Red > 15 Minutes Datamart Extraction Green <= 24 Hours, Yellow 24-48 hours, Red > 48 hours Datamart Rollup Green <= 24 Hours, Yellow 24-48 hours, Red > 48 hours Rate Matrix - Full Best practice is to run a full rate matrix nightly Green <= 24 Hours, Yellow 24-48 hours, Red > 48 hours Rate Matrix - Incremental Green <= 24 Hours, Yellow 24-48 hours, Red > 48 hours Load Data Warehouse - Full Load Green <= 24 Hours, Yellow 24-48 hours, Red > 48 hours Load Data Warehouse - Incremental Green <= 24 Hours, Yellow 24-48 hours, Red > 48 hours Load Data Warehouse Access Rights Green <= 24 Hours, Yellow 24-48 hours, Red > 48 hours The Clarity Health portlet provides a quick glance into the health of key components and critical jobs in the Clarity environment. The following metrics are monitored: Process Engine Heartbeat should refresh itself every 10 minutes. Process Engine is responsible for the triggering of processes. Green <= 10 Minutes, Yellow 11-15 Minutes, Red > 15 Minutes Time Slices Time Slices are required for accurate reporting. Best practice is for the Time Slicing job to run every minute. Please note there are some jobs that will cause the time slicing to delay so a momentary delay is normal. Green <= 10 Minutes, Yellow 11-15 Minutes, Red > 15 Minutes Datamart Extraction Green <= 24 Hours, Yellow 24-48 hours, Red > 48 hours Datamart Rollup Green <= 24 Hours, Yellow 24-48 hours, Red > 48 hours Rate Matrix - Full Best practice is to run a full rate matrix nightly Green <= 24 Hours, Yellow 24-48 hours, Red > 48 hours Rate Matrix - Incremental Green <= 24 Hours, Yellow 24-48 hours, Red > 48 hours Load Data Warehouse - Full Load Green <= 24 Hours, Yellow 24-48 hours, Red > 48 hours Load Data Warehouse - Incremental Green <= 24 Hours, Yellow 24-48 hours, Red > 48 hours Load Data Warehouse Access Rights Green <= 24 Hours, Yellow 24-48 hours, Red > 48 hours
 -
 The Reset Admin Password technical trick provides the queries necessary to reset the administrator's password via the database. Passwords are forgotten, overwritten and misplaced often; using this technical trick, the support team will always have a back-up plan to gaining back access to the system.
 -
 Does project and idea estimation take too long and lack visibility? This class will address one of the most common pain points within organizations: how to involve the right people within a timely project estimate. Learn Rego’s model for defining, calculating, and modifying idea and project estimates, so you can increase throughput and ROI.
 -
 CA has advertised the addition of RESTful APIs into the core product in version 14.3. What does this mean to you? What does this do to help you support CA PPM? This class will review the new APIs and discuss what they enable for you.
 -

Rego’s Clarity Adoption Metrics package consists of two sets of metrics: Project metrics, and Resource metrics. Project metrics measure how effectively project managers are using Clarity to manage their projects. Resource metrics measure how effectively resource managers are using Clarity to manage resources. Metrics are scored on a scale of 0 to 5, with higher scores indicating greater adoption and use. All metrics can be viewed numerically or graphically, and can be broken out by OBS. In addition, metric data can display as a 12-month rolling history to help identify trends. Project metrics can also display by lowest / highest adoption rates for a specific resource metric or all resource metrics. There is a variety of way to view the Adoption Metric data, therefore, Rego has made this simple by creating an Adoption Metrics object that contains multiple tabs. Each tab displays one or more of the Project or Resource Adoption Metrics. Based on the nature of the Metrics some tabs will allow the ability to use a pull down menu to select a specific Adoption Metric. There is also a Metrics trending view that pulls monthly snapshots of the metrics. Project metrics consist of the following: - Project Status Reporting – Measures how well PMs create and publish project status reports.
- Project Risk Adoption – Measures how well Risks are being used and managed.
- Project Issue Adoption – Measures how well Issues are being used and managed.
- Project Schedule – Measures how well PMs create tasks and keep the project schedule current.
- Project Baseline – Measures whether or not baselines exist.
- Project Zero ETC’s – Measures how well the PM assigns resources to tasks with ETCs.
- Project Past ETC’s – Measures how many improperly scheduled tasks the PM has.
- Project Milestone / Key Tasks – Measures how well PMs create and manage Milestones / Key Tasks.
- Project Schedule Variance – Measures how effectively PMs manage their schedules.
- Project Effort Variance – Measures how effectively PMs manage their project efforts.
- Project Budget Variance – Measures how effectively PMs manage budgets or cost plans.
- Project Unfilled Roles – Measures project roles with allocations that are already started or starting within the next 30 days.
- Project Data Quality – Measures how effectively PMs complete the Description, Stage, Progress, Objective, and Sponsor/Business Owner fields.
- Project Commitment – Measures the hard allocations for a project over a two week time frame.
- Resource Clarity Usage – Measures how often users log into Clarity.
- Resource Timesheet – Measures if timesheets post in a timely manner.
- Resource Allocation – Measures how well RMs keep total resource allocations within the expected range for future time periods.
- Resource Actualy Utilization – Measures how well Resource allocations match actuals.
- Resource Allocation Date in the Past – Measures how many resources are open for time entry with dates in the past.
- Resource Data Quality – Measures how well RMs complete the Resource Manager and Primary Role fields and optionally the Skill and Employment Type fields.
- Resource Commitment – Measures how much resource available time is committed to projects.
-
 “Of course we have a plan for PPM!” This might be the response of any organization that’s considering PPM or has a solution in place. But having the technology doesn’t necessarily mean having an effective plan for it. This white paper breaks down what it means to have a strategic PPM roadmap, and why your organization should always keep it current and close at hand. We’ll define the elements that make a roadmap effective and provide seven reasons it can make the business journey worthwhile. This White Paper is downloaded from the Rego Consulting site. You will be asked to provide your email address and current ppm tool. - http://info.regoconsulting.com/ppm-roadmap-white-paper ** No Download - Do not Add to Cart **
 -
 Effective resource management is vital for delivering successful and profitable projects. Get it right and costs will be controlled, objectives achieved, and deadlines met. Get it wrong and we run the risk of not just project timescales slipping but also margins and competitive advantages eroding. This paper looks at resource management best practices and how we can adopt practices to increase project quality, agility, and efficiency. This White Paper is downloaded from the Rego Consulting site. You will be asked to provide your email address and current ppm tool. - http://info.regoconsulting.com/smarter-resource-mgmt-whitepaper ** No Download - Do not Add to Cart **
 -
 Resource Management - Are You Doing it Right? Companies of all shapes and sizes need to know if they have the right people working on the right things at the right time, to meet their objectives. Rego's own Grant Zemont has put together this report to help your company learn the best practices for setting up a resource management office correctly. Download the free report here. This White Paper is downloaded from the Rego Consulting site. You will be asked to provide your email address and current ppm tool. - http://info.regoconsulting.com/rmo-report ** Do not Add to Cart - No Downloadable File**
 -
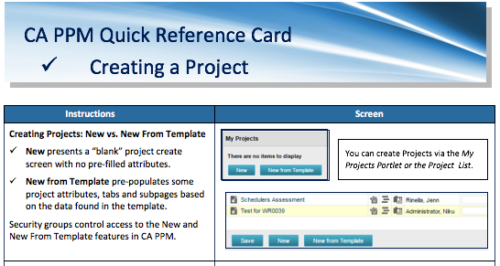 A Quick Reference Card to assist in creating a project in CA PPM. Reviews options of creating from New or New from Template.
 -
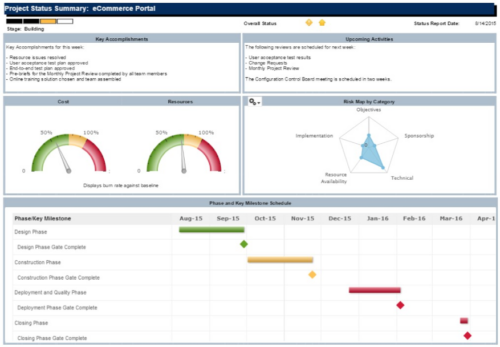 The Project Status Summary report is a transaction based Jaspersoft report that does not require the Load Jaspersoft Datawarehouse job to be run. The report will pull real-time data from the transaction tables in Clarity. This report can be run from either the Advanced Reporting or Reports and Jobs area within Clarity. The Project Status Summary report displays summary information about a project, including current stage, overall status, key accomplishments, upcoming activities, the cost and amount of resources that are consumed, mapped risks indicating categories with a high number of risks, and a high-level Gantt chart displaying information about the project phases and key milestones.
 -
 Fiscal periods in DWH may need to be changed if we need to increase or decrease the number of periods for reporting.
 -
 So, you have the portlet xogged in, what now? This guide will show you how to create a page, add the portlet to the page, and add the page to the menu. This activity requires the appropriated admin rights to add content to CA PPM.
 -
 Course description: “Are some of your users leveraging a Smartsheet add-on for project planning, or are you looking for an alternative to OWB and MSP? Learn how this new scheduling tool is making waves and adding value for project managers working within CA PPM.” Download file is the presentation slidedeck.
 -
 Course description: “How are other companies storing or managing documents? This session will discuss options for using native CA PPM, linking to SharePoint, connecting directly to SharePoint, using Google docs, as well as other options. This session will also discuss options for document approval workflows within CA PPM for both collaborative documents and attachment fields.” Download file is the slide deck used during the presentation.
 -
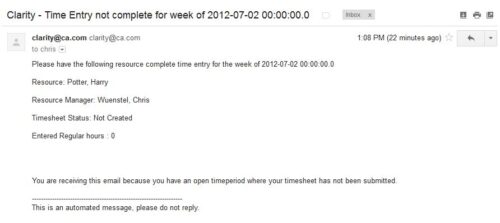 The Time Tracking Stalker – Resource workflow process is used to notify resources that fail to submit a timesheet in a prior week. The workflow checks for active resources, hire/termination dates, track mode, and open for time entry. This process helps to ensure resources submit timesheets in a timely manner. In version 13, the email can be enhanced to include colors, bold, underline, and other HTML formatting.
 -
 Course Description: This class will provide a list of daily and weekly activities that every resource manager should follow to leverage Clarity PPM more effectively.
 -
 Course Description: This class will provide a list of daily and weekly activities that every project manager should follow to leverage Clarity PPM more effectively.
 -
 It is quite common for Rally and Jira to coexist. However, connecting them effectively enhances the value stream for development teams and product owners. Learn what is available to make this happen along with some typical design patterns.
 -
 Are you starting a resource management implementation, or do you want to compare how you are using these functions vs. others or best practices? In this class we will discuss some best practices from successful customers.
 -
 Are you starting a demand/portfolio management implementation, or do you want to compare how you are using these functions vs. others or best practices? In this class we will discuss some best practices from successful customers.
 -
 Have you looked in the regoXchange or reviewed Rego’s innovation offerings? This class will show you the power of Rego’s pre-built content library, integrations, and other assets. See example after example of portlets, processes, and materials you can use to add value to your instance of Clarity. Learn how you can introduce email-based approvals with Rego's action item responder. Get a peek at Rego's new MSP integration that avoids the issues faced with the OOTB integration. Finally, understand Rego's pre-built connectors and how they can benefit your instance. Including blueprint migrator. Include free tools like GEL builder, query, XOGbridge.
 -
 The Dashboard: Project Information portlet gives a set of high-level information about the project. The portlet will pull the "id" from the page it is placed on, so this portlet is usually placed on the project dashboard tab. The portlet displays the name, project ID, project manager, description, start date, finish date, baseline start, and baseline finish.
 -
 This training document is a Rego Consulting Quick Reference Guide to assist with the management of the Grid View within Hierarchies in Clarity’s Modern User Experience. This doc references version 16.1 views. Document covers information on how to export to CSV, filter, create and save Views, use of the Column Panel and the Details panel.
 -
 This training document is a Rego Consulting Quick Reference Guide to assist with the management of the Card View within Hierarchies in Clarity’s Modern User Experience. This doc references version 16.1 views. Document provides detail on View Options, Color By, Card Fields and Card Metrics. Information on how to roll up metrics via an aggregation or calculation method.
 -
 This training document is a Rego Consulting Quick Reference Guide to assist with the utilization of Tasks and To Do’s in Clarity’s Modern User Experience. This doc references version 16.1 views. Document references the Tasks and To Do’s menu items and their associated widgets.
 -
 A presentation slide deck from Rego University 2022. This course reviewed Adoption Metrics and Reliable Data Collection.
- Reliable Data Collection and Business Performance
- Adoption Metrics and Customer Adoption
- Data Quality, Data Integrity and Ensuring User Confidence
- Business Performance
- Reliable Data Collection and Business Performance
-

A presentation slide deck from Rego University 2022. This document reviews the best practices for project management in Clarity. - Typical PM Activities
- Use Clarity: Get Off of Excel
- Make Information Easier to Access
- Make Flags Easy to Identify
- Simplify & Automate Reporting
- Open Discussion #3
- Work with a Regular Cadence
- Sample Schedule
-
 A presentation slide deck from Rego University 2022. The course discusses factors that differentiate Requirements.
- Introduction (What & Why)
- Definition & Uses of Requirements
- The Challenges in Requirements in Software
- Revisit the Agile Taxonomy
- The Transition from Traditional to Agile
- Rethink the Agile Portfolio
- Guidelines and Characteristic of Taxonomy
-
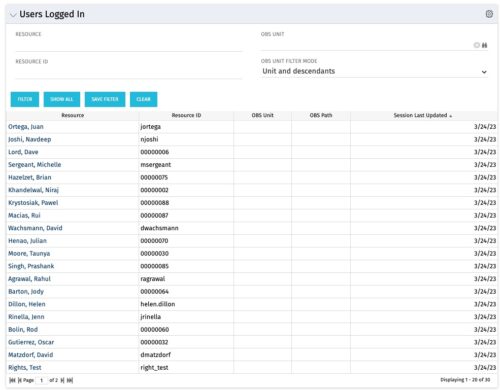 The Users Logged In portlet displays all users logged into the system. This portlet is helpful to determine the capacity during peak times, users still working before downtime, and the ability to view users logged in during the day. The portlet will display the resource, ID, OBS unit, OBS path, and when the user’s session was last updated.
 -
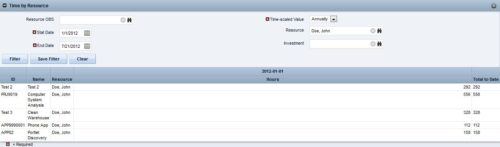
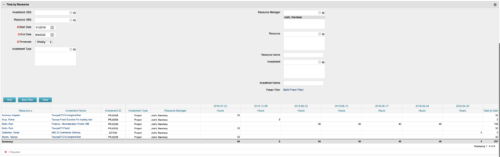 This portlet displays the actual hours resources entered against investments. The per-period actual hours can be showed in days, weeks, months, quarters, or years. The data can be filtered by Resource, Resource Manager, OBS Unit, Investment and time period
 -
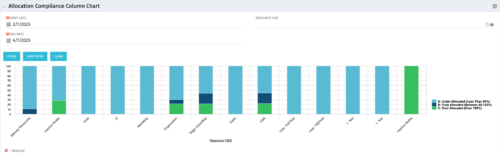 This view depicts Allocation Compliance for resources grouped by OBS. Using the daily Resource Availability and Daily Resource Allocation Time Slices this column chart groups aggregate Allocation vs Availability by OBS Unit. The chart allows quick analysis to see if resources are adequately allocated (between 80% to 120% of their capacity) or if they are significantly under or over allocated. NOTE: The grouping of OBS unit is limited to 1 level below the selected OBS in the portlet filter.
 -
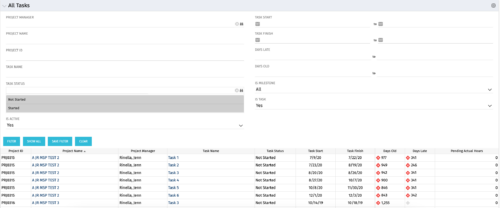 The All Tasks portlet displays all tasks related to active projects that the logged in user has view rights to. The portlet provides the project manager a single place to view tasks across multiple projects without having to go into each project individually, and allows for more efficient management and reporting across projects. The portlet displays project actuals and estimates from the project (datamart tables). The portlet allows analysis like:
- PMs may have several critical tasks that were supposed to start on a certain date. To verify progress, they filter for that start date to perform a review of the tasks.
- PMs can review days late to see how tasks are doing against the baseline date (<7 days is green, 7-14 is yellow, and >14 is red)
- PMs can review days old to see how tasks are doing against today’s date (<7 days is green, 7-14 is yellow, and >14 is red)
Column Label Description Project ID Unique project identifier Project Name Name of the project Project Manager Manager of the project Task Name Name of the task Task Status Not Started, Started, or Completed Task Start Start Date of this task Task Finish Finish Date of this task


Copyright 2023 • Rego Consulting Corporation • Privacy Policy