-
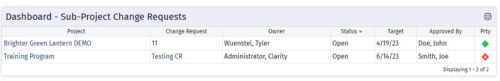 The Program Dashboard Sub-Project Change Requests portlet gives the ability to view all change requests of sub-projects of a program. The portlet will pull the "id" from the page it is placed on, so this portlet is usually placed on the dashboard tab. The portlet sorts the issues first by status, in descending order, and then by target date. It displays the sub-project name, change request name, owner, status, target date, approved by, and the priority.
 -
The Program Dashboard Sub-Project Change Requests portlet gives the ability to view all change requests of sub-projects of a program. The portlet will pull the "id" from the page it is placed on, so this portlet is usually placed on the dashboard tab. The portlet sorts the issues first by status, in descending order, and then by target date. It displays the sub-project name, change request name, owner, status, target date, approved by, and the priority.
-
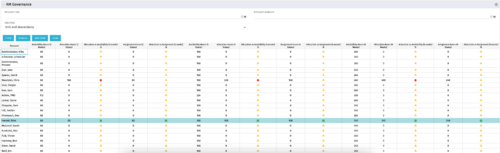 The RM Governance portlet provides resource availability, allocation, and comparison of the two values at 2, 4, and 8-week intervals. Allows searching on any RM or resource OBS instead of pre-filtering for the logged in user.
 -
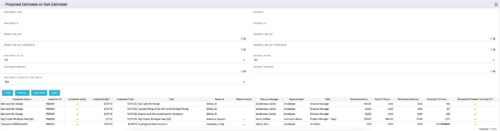 The Proposed Estimates vs. Task Estimates portlet gives the ability to identify when the Proposed Estimates for any given task exceed the Task Estimates. The portlet filters by investment name, investment ID, project OBS unit, investment active (yes/no/all), investment manager, resource name, resource ID, resource OBS unit, resource active (yes/no/all), and resource manager. Additionally, the results can be filtered by the proposed ETC greater than task ETC flag (yes/no/all). The information provided on the portlet includes the investment name, investment ID, investment active (yes/no), investment start/end dates, task name, resource name, resource active (yes/no), resource manager, total hours, total ETC, proposed ETC greater than task ETC flag (yes/no), pending actual hours, and proposed ETC hours.
 -
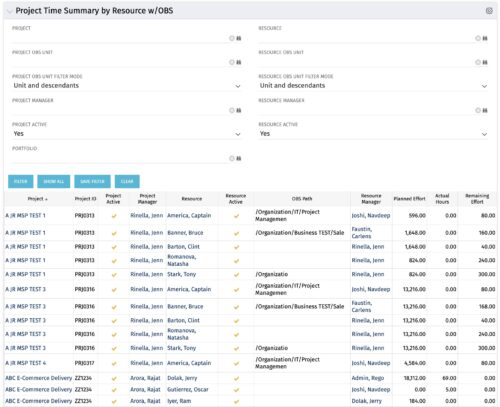 The purpose is to show actual hours, planned effort and remaining effort at the resource level, with the addition of OBS levels to support filtering and manipulation of the exported data.
 -
The purpose is to show actual hours, planned effort and remaining effort at the resource level, with the addition of OBS levels to support filtering and manipulation of the exported data.
-
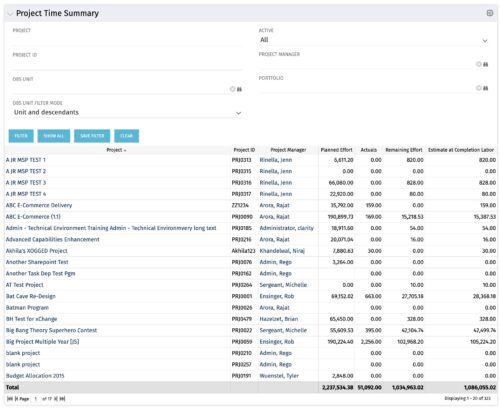 Project managers may use this portlet to show the planned effort and the remaining effort on projects. Includes actual hours as well as estimate at completion. You may narrow the results by filtering by project name, project manager, project OBS, or active flag. The portlet will display each project by ID, name, project manager, planned effort (total allocation hours), actual hours, remaining effort (ETC), and estimate at complete (actual + ETC).
 -
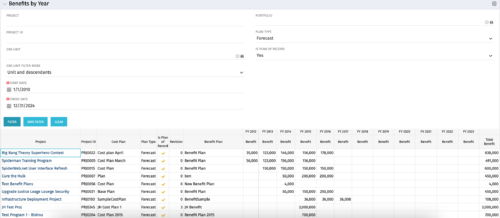 The Benefits by Year portlet summarizes Benefit totals by year and is searchable by Project, OBS and Portfolio. The results display both Budgeted Benefit Plans and Forecast Plans and the associated Cost Plan. Users can make use of this portlet to view Benefit Plan totals across an OBS or Portfolio or to compare the Budgeted Benefit of a Project versus the current plan.
 -
 The My Resource Vacation portlet allows a resource to view the current logged in users' annual vacation allowance, as set by the resource manager, against the resource vacation calendar hours and actual posted timesheet hours. The portlet is useful for determining the amount of hours a resource has requested off and has remaining. The portlet also ensures the resource has accounted for all annual vacation allowance hours in the calendar and has posted time for all past calendar request hours.
 -
The My Resource Vacation portlet allows a resource to view the current logged in users' annual vacation allowance, as set by the resource manager, against the resource vacation calendar hours and actual posted timesheet hours. The portlet is useful for determining the amount of hours a resource has requested off and has remaining. The portlet also ensures the resource has accounted for all annual vacation allowance hours in the calendar and has posted time for all past calendar request hours.
-
 The Hours and Cost by Vendor – Grid portlet displays vendor hour or costs by month grouped by vendor. Using this portlet, management is provided with a quick overview of vendor costs or hours by month for a set of time without running a report or navigating to each resource individually. This portlet uses the monthly actual timeslices. The user may filter by vendor, vendor ID, date, and hours/cost in addition to the start/finish and hours/cost. Once populated, the grid will display all vendors that currently have hours/cost for the selected time frame.
 -
The Hours and Cost by Vendor – Grid portlet displays vendor hour or costs by month grouped by vendor. Using this portlet, management is provided with a quick overview of vendor costs or hours by month for a set of time without running a report or navigating to each resource individually. This portlet uses the monthly actual timeslices. The user may filter by vendor, vendor ID, date, and hours/cost in addition to the start/finish and hours/cost. Once populated, the grid will display all vendors that currently have hours/cost for the selected time frame.


Copyright 2023 • Rego Consulting Corporation • Privacy Policy