-
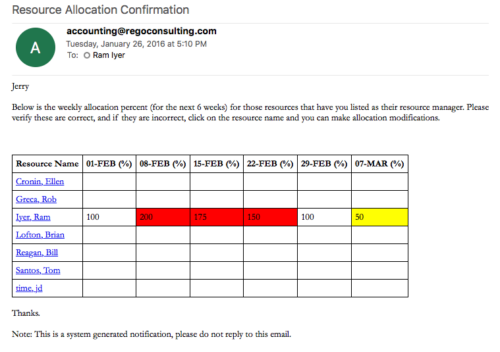
 Process sends an email to RM, for resources assigned, that indicates the allocation percentage for each resource for the next 6 weeks. Email has links to each resource so that allocation modifications can be made as required.
 -
 Process provides the RM with assigned resources availability percentage for the next four weeks. Grid displays all resources with their total allocated hours by week, and an average availability percent (4 Wk Avail %) for next four weeks. If % Available is negative, this indicates an over-allocation. Zero% Average Availability indicates fully allocated (no remaining availability). Links at the resource name allow for modifications by the RM.
 -
Process provides the RM with assigned resources availability percentage for the next four weeks. Grid displays all resources with their total allocated hours by week, and an average availability percent (4 Wk Avail %) for next four weeks. If % Available is negative, this indicates an over-allocation. Zero% Average Availability indicates fully allocated (no remaining availability). Links at the resource name allow for modifications by the RM.
-
 Does your organization struggle with resource management? Have you considered creating a Resource Management Office (RMO)? This session will review how some organizations are using RMOs to drive adoption and effectively manage resources, including real world examples of RMO setup and execution.
 -
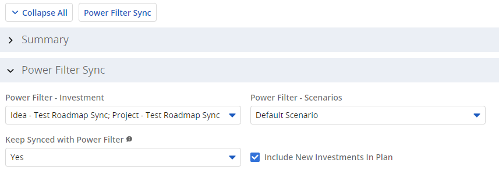 The Power Filter Sync functionality allows users to define rules for syncing investments to Roadmaps or Hierarchies on a scheduled (and on-demand in Roadmaps only) basis. Users may choose one or more saved views from investments that are allowed on the Roadmap/Hierarchy to define the list of investments they want that Roadmap/Hierarchy to contain. If the option to Keep Synced with Power Filter is set to Yes, then each time the process runs, the Investments returned by the saved views will be added to the Roadmap/Hierarchy if they don’t exist there already, and any investment not found in the saved views will be removed.
 -
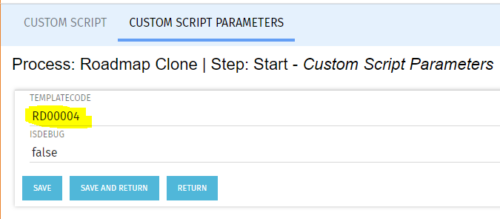 The Roadmap Cloning process creates a clone of any existing roadmap. It should be run using the “Execute a Process” job. To specify a roadmap to clone the Start Step Action’s Custom Script Parameters need to be updated to include the proper roadmap ID in the templateCode field.
 -
The Roadmap Cloning process creates a clone of any existing roadmap. It should be run using the “Execute a Process” job. To specify a roadmap to clone the Start Step Action’s Custom Script Parameters need to be updated to include the proper roadmap ID in the templateCode field.
-
The Roadmap Cloning process creates a clone of any existing roadmap. It should be run using the “Execute a Process” job. To specify a roadmap to clone the Start Step Action’s Custom Script Parameters need to be updated to include the proper roadmap ID in the templateCode field.
-
 Out of the box, there is no way to export or report on the Modern UX Roadmap Grid view. This report allows the end user to select one or more roadmaps and provides an exportable view of several OOTB fields from those roadmaps. When exported to and open in excel, the first tab will display a combined view of all selected Roadmaps, one row for every Roadmap Item, and additional tabs will display Roadmap-specific views. Custom attributes may be added to the report by your developers.
 -
Out of the box, there is no way to export or report on the Modern UX Roadmap Grid view. This report allows the end user to select one or more roadmaps and provides an exportable view of several OOTB fields from those roadmaps. When exported to and open in excel, the first tab will display a combined view of all selected Roadmaps, one row for every Roadmap Item, and additional tabs will display Roadmap-specific views. Custom attributes may be added to the report by your developers.
-
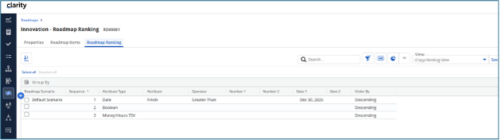
 The Rego Roadmap Ranking provides the ability to rank Roadmap Items within individual Roadmap Scenarios. The function allows the user to define a hierarchical sequence to defined attributes to create a set of rules to generate an auto-ranking, by scenario. Large sets of ranking rules increase complexity and variability, so choose initial rules carefully. When the rank order is configured, a process is actioned that auto-ranks the Roadmap Items for the selected Roadmap Scenario. The Roadmap Ranking can be viewed through the Timeline, Board, or Grid View.


Copyright 2023 • Rego Consulting Corporation • Privacy Policy