-
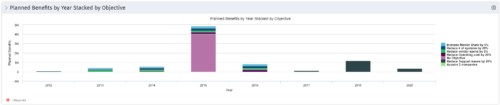 This Portlet starts by pulling Active Investments from a Classic UI Portfolio. It then looks for the Cost Plan of Record and its’ linked Benefit Plan. It then aggregates the Planned Benefit and groups it by Objective, then presents a stacked bar chart.
 -
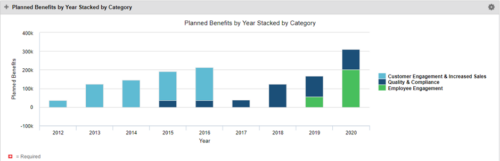 This Portlet starts by pulling Active Investments from a Classic UI Portfolio. It then looks for the Cost Plan of Record and its’ linked Benefit Plan. It then aggregates the Planned Benefit and groups it by Category, then presents a stacked bar chart.
 -
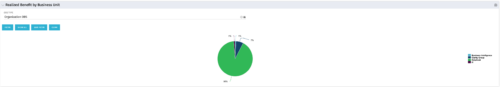 Pie Chart that aggregates Realized Benefit (Total Actual Benefit) by OBS for active projects. Only a Benefit Plan associated with the Cost Plan of Record will return data. The filter allows you to select which OBS filter you prefer to use for this pie chart, however, only an OBS associated with Projects will return data.
 -

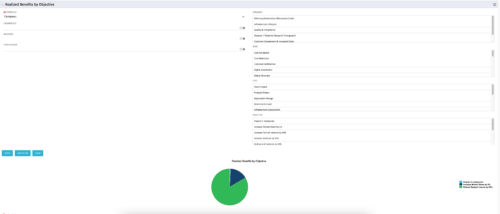 This portlet displays a Pie Chart of a Portfolio’s Realized Benefits partitioned into pie slices by the portfolio’s Investments’ Objectives. Clicking on any pie slice (Objective) drills-down into a portlet that lists the Investments that make up that slice.
 -
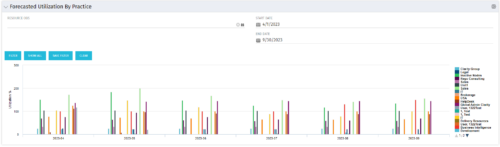 This Bar Chart Portlet displays a vertical bar for every Practice (Resource OBS) per Month. The bar represents the Utilization % (Resource Allocations divided by Resource Availability). Filters are provided for Resource OBS (Units and Descendants) and the date range to be displayed.
 -
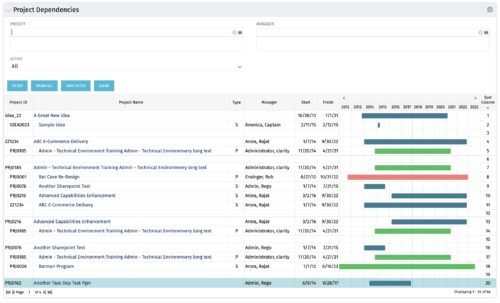
The Project Dependencies portlet displays all projects and their associated dependencies that the logged in user has rights to. This can assist in scheduling and visualizing the breakout of dependencies. The table below describes the available columns in the portlet. Column Label Description Project ID ID of the project Project Name Name of the project Type Relationship to above project, Parent Project (P) or Sub Project (S) Manager Manager of the project Start Start Date of the project Finish Finish Date of the project Gantt Visualization of project timelines Sort Column Used to order the columns for proper display of the portlet dimkey Internal code used by the query Inv_hlth_int Internal code used by the query Link_dbid Internal code used by the query link_toggle Internal code used by the query rel_active Internal code used by the query rel_dbid Internal code used by the query rel_mgr_dbid Internal code used by the query rel_sort Internal code used by the query -
The Project Dependencies portlet displays all projects and their associated dependencies that the logged in user has rights to. This can assist in scheduling and visualizing the breakout of dependencies. The table below describes the available columns in the portlet. Column Label Description Project ID ID of the project Project Name Name of the project Type Relationship to above project, Parent Project (P) or Sub Project (S) Manager Manager of the project Start Start Date of the project Finish Finish Date of the project Gantt Visualization of project timelines Sort Column Used to order the columns for proper display of the portlet dimkey Internal code used by the query Inv_hlth_int Internal code used by the query Link_dbid Internal code used by the query link_toggle Internal code used by the query rel_active Internal code used by the query rel_dbid Internal code used by the query rel_mgr_dbid Internal code used by the query rel_sort Internal code used by the query -
 Bar Chart displays average percent variance for all active projects by OBS unit. Percent variance = Planned Cost - Budgeted Cost / Budgeted Cost * 100. Projects with no Budgeted Cost are ignored for the calculation. Then all project variance percentages are algebraically added (some may be negative), and divided by total projects with a variance. This yields the Average Percent Variance. This calculation is performed for active projects in each OBS unit. OBS units include all units at all levels where projects are attached. Portlet filterable by OBS, Financial Status, and Financially Approved. Vertical axis = OBS Unit Name. Horizontal axis = Variance Percent. Data value = Average Percent Variance. Mouseover value = OBS Name + Average Variance Percent.
 -
Bar Chart displays average percent variance for all active projects by OBS unit. Percent variance = Planned Cost - Budgeted Cost / Budgeted Cost * 100. Projects with no Budgeted Cost are ignored for the calculation. Then all project variance percentages are algebraically added (some may be negative), and divided by total projects with a variance. This yields the Average Percent Variance. This calculation is performed for active projects in each OBS unit. OBS units include all units at all levels where projects are attached. Portlet filterable by OBS, Financial Status, and Financially Approved. Vertical axis = OBS Unit Name. Horizontal axis = Variance Percent. Data value = Average Percent Variance. Mouseover value = OBS Name + Average Variance Percent.
-
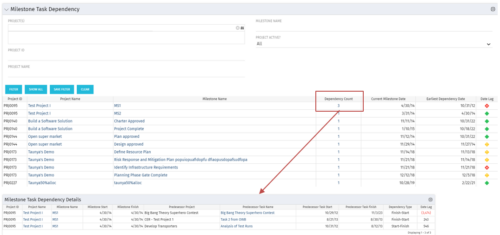 The Milestone Task Dependency portlet shows the milestone task dependency count and has a drilldown to the details. The portlet looks at the dependency impact on milestones, and is not limited to just dependencies that are on different projects. The lag days calculation is based off of the maximum dependency impact and the drilldown portlet (Milestone Task Dependency Details :::: rego_milestone_dependency_det)shows the details for each.
 -
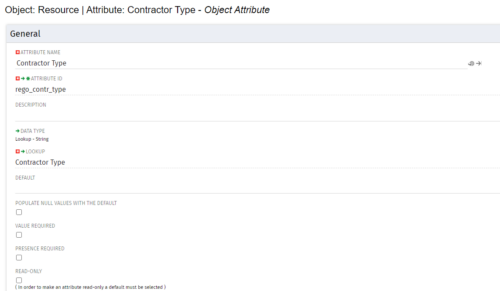
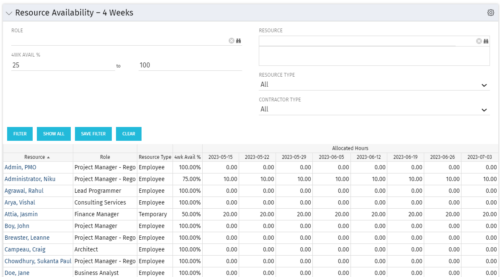 Resource Availability – 4 Weeks is a grid portlet that displays all resources with their total allocated hours by week, and an average availability percent (4 Wk Avail %) for next four weeks. If % Available is negative, this indicates an over-allocation. Zero% Average Availability indicates fully allocated (no remaining availability). Filterable by Role, Resource, Resource Type, Full-Time/Part-Time, Availability Range. Contractor Type is a custom attribute (Lookup - String) created on the Resource object. It is attached to the lookup, Contractor Type (Lookup ID: REGO_CONTRACTOR_TYPE) that has static values Part Time (PT) and Full Time(FT).
 -
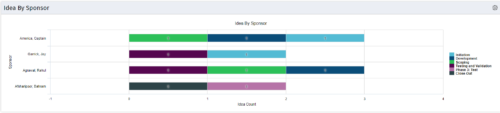 This portlet uses a bar graph to show the count of ideas by stage - grouped by the sponsor OBS. The X-axis displays the count and the Y-axis denotes the sponsor.


Copyright 2023 • Rego Consulting Corporation • Privacy Policy