-
 In Jaspersoft Studio, Static Text and Text Fields can display text with markup instead of plain text. This allows a wide variety of customization to how the text is displayed. This Tech Trick provides Instructions on how to use this feature of Jaspersoft Studio.
 -
 This Tech Trick covers instructions for modifying the default colors of a Chart in Jaspersoft Studio Reports using a dynamic expression. It includes step-by-step instructions for an example bar chart color change.
 -
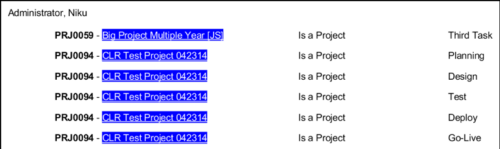
 Out of the box, there is no way to export or report on the Modern UX Roadmap Grid view. This report allows the end user to select one or more roadmaps and provides an exportable view of several OOTB fields from those roadmaps. When exported to and open in excel, the first tab will display a combined view of all selected Roadmaps, one row for every Roadmap Item, and additional tabs will display Roadmap-specific views. Custom attributes may be added to the report by your developers.
 -
Out of the box, there is no way to export or report on the Modern UX Roadmap Grid view. This report allows the end user to select one or more roadmaps and provides an exportable view of several OOTB fields from those roadmaps. When exported to and open in excel, the first tab will display a combined view of all selected Roadmaps, one row for every Roadmap Item, and additional tabs will display Roadmap-specific views. Custom attributes may be added to the report by your developers.
-
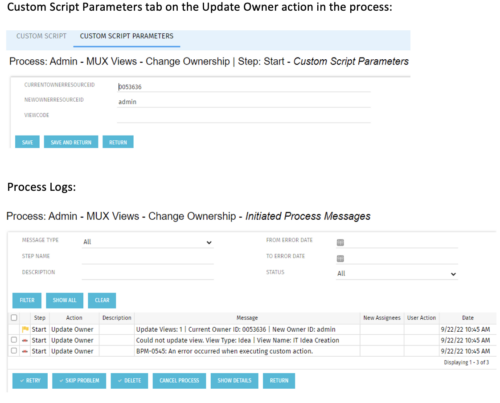 This is a standalone process that can be run by an admin to change the ownership of MUX views from a specified user to another specified user. The process contains a single custom script, which has the following parameters that must be updated prior to running the process:
- currentOwnerId (required): Resource ID for the current Owner (unique_name from srm_resources table)
- newOwnerId (required): Resource ID for the new Owner (unique_name from srm_resources table)
- viewCode (optional): Code for the specific view to update - leave blank if you want to transfer ownership for all views (odf_ui_views.code)
- Navigate to the process called Admin - MUX Views - Change Ownership.
- Navigate to the Start Step tab, Click on the Update Owner action, and click the Custom Script Parameters tab.
- Enter the Resource ID for the current view owner into the currentOwnerId parameter.
- Enter the Resource ID for the new owner into the newOwnerId parameter.
- If you want to update a specific view only, enter that in the viewCode parameter.
- Run the process via Organizer in Classic.
-
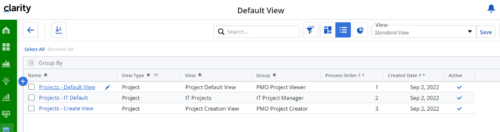
Manage default views for new users based on security groups or publish a view to all users in a specified security group. For more details, please refer to the detailed documentation.
-
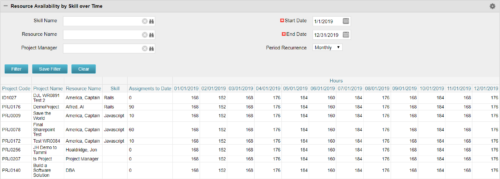 Resource Availability by Skill over Time is a grid portlet that provides Resource Managers a single place to view Resources’ skill sets along with their availability (hrs.) over a period of time. This report also displays the assigned Investments to date and the Actual hours to date for the Resource on those respective Investments. Users can further narrow their search by Skill Name, Resource Name, Project Manager, Start Date, End Date and Period Recurrence.
 -
Resource Availability by Skill over Time is a grid portlet that provides Resource Managers a single place to view Resources’ skill sets along with their availability (hrs.) over a period of time. This report also displays the assigned Investments to date and the Actual hours to date for the Resource on those respective Investments. Users can further narrow their search by Skill Name, Resource Name, Project Manager, Start Date, End Date and Period Recurrence.
-
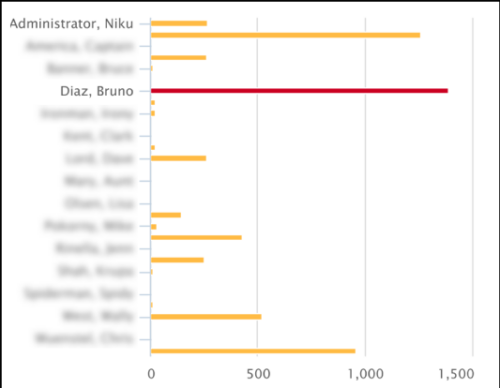
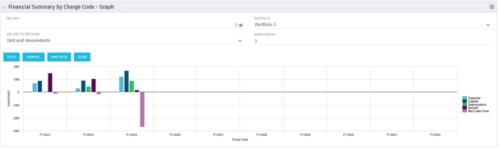 The Financial Summary by Charge Code - Graph portlet displays yearly charge code financial information across all projects in a bar graph. This portlet provides management with a snapshot of all projects’ financial information totaled and sorted by expense, capital, depreciation, benefit, and net cash flow. The depreciation is calculated based on a straight line method. The user may filter on OBS unit and/or portfolio to narrow down the search results.
 -
The Financial Summary by Charge Code - Graph portlet displays yearly charge code financial information across all projects in a bar graph. This portlet provides management with a snapshot of all projects’ financial information totaled and sorted by expense, capital, depreciation, benefit, and net cash flow. The depreciation is calculated based on a straight line method. The user may filter on OBS unit and/or portfolio to narrow down the search results.
-
The Financial Summary by Charge Code - Graph portlet displays yearly charge code financial information across all projects in a bar graph. This portlet provides management with a snapshot of all projects’ financial information totaled and sorted by expense, capital, depreciation, benefit, and net cash flow. The depreciation is calculated based on a straight line method. The user may filter on OBS unit and/or portfolio to narrow down the search results.


Copyright 2023 • Rego Consulting Corporation • Privacy Policy