-
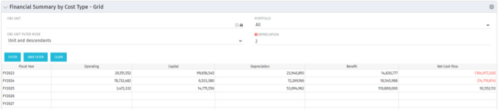 The Financial Summary by Cost Type - Grid is very beneficial as it provides actual numbers for each years financial picture beginning with current year and going forward into the future. It will show the user where they need to concentrate their efforts in order to meet financial commitments.
 -
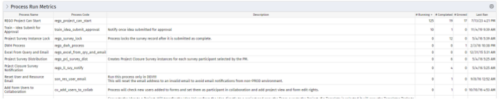 For each process, the Process Run Metrics portlet shows the Process Name, Process Code, Description, # Running, # Completed, # Errored, and Last Run Date. This portlet is ideal for system administrators and support staff needing to monitor the health of the environment. Viewers of this portlet can get a sense of the complexity & health of the environment with the # of processes running and visibility into processes that errored out. The table below describes the available filter fields in the portlet.
Column Label Description Process Name Name of the process Start Date Start date of the process’s last ran date End Date End date of the process’s last ran date Description Description of the process Process ID ID of the process -
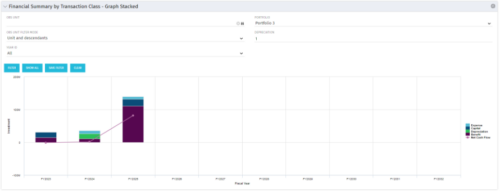 This stacked bar graph portlet displays the financial summary by transaction class for the current and future fiscal annual periods. Filters are provided for:
- OBS
- Portfolio
-
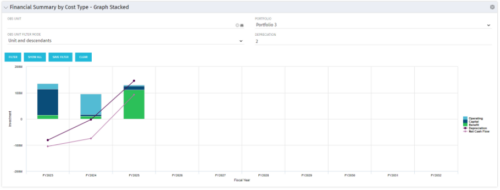 The Financial Summary by Cost Type - Graph Stacked provides a visual stacked graph for each years financial picture beginning with current year and going forward into the future. It will show the user where they need to concentrate their efforts in order to meet financial commitments.
 -
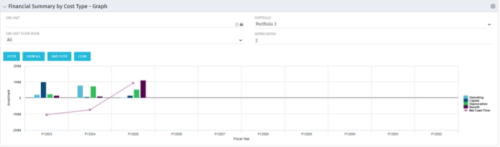 The Financial Summary by Cost Type - Graph provides a visual stacked graph for each years financial picture beginning with current year and going forward into the future. It will show the user where they need to concentrate their efforts in order to meet financial commitments.
 -
The Financial Summary by Cost Type - Graph provides a visual stacked graph for each years financial picture beginning with current year and going forward into the future. It will show the user where they need to concentrate their efforts in order to meet financial commitments.
-
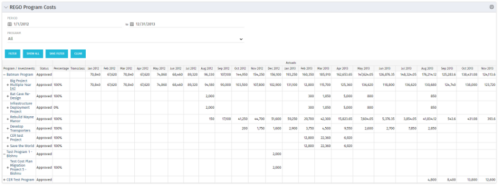 The Program Costs portlet looks like a cost plan. It will summarize all cost plans from projects within the program and display the totals.
 -

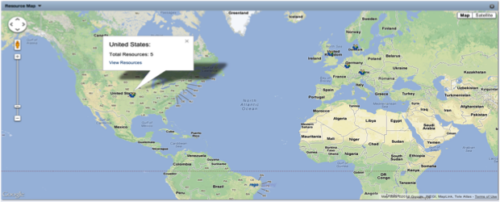 The Resource Map portlet is designed to display resource counts, by country, on a map of the world. Clicking one of the resource markers on the map will display the total resource count for that country. Additionally, a link is provided that connects to a grid portlet which displays all resources that reside in that country. The ability to zoom in and out on areas of the world is available. Due to the requirements outlined in the Special Installation Instructions section, this portlet requires 2-3 Rego Consulting hours to install. Further customization of the data on this map and its associated grid portlet may be requested. Please contact us for more details.
 -
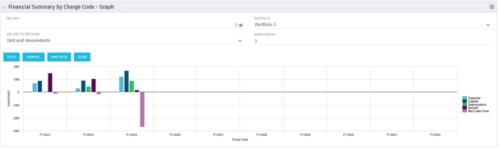 The Financial Summary by Charge Code - Graph portlet displays yearly charge code financial information across all projects in a bar graph. This portlet provides management with a snapshot of all projects’ financial information totaled and sorted by expense, capital, depreciation, benefit, and net cash flow. The depreciation is calculated based on a straight line method. The user may filter on OBS unit and/or portfolio to narrow down the search results.
 -
 This portlet pulls back the Availability and Allocation totals by Role between a user-specified Start and Finish Date, then the user can drilldown to look at the information for Applications. The Time Period filter allows for comparing these values across different timeframes (monthly, weekly, quarterly, annual) as desired. Other filters allow for looking at Active or Inactive Roles (or both) and including Active or Inactive Projects (or both) in the totals.
 -
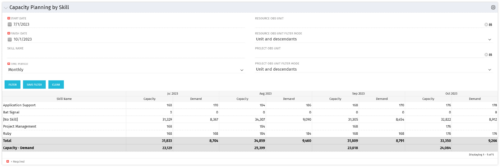 The Capacity Planning by Skill portlet displays the capacity and demand by skill for a selected timeframe. This portlet is used to determine which skills are in high demand, being used efficiently, and how much capacity may be remaining for the time period. The portlet may be filtered by skill name, resource OBS or project OBS to narrow the results.
 -
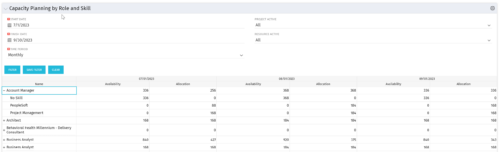 The Capacity Planning by Role and Skill portlet displays all availability and demand in the system summarized by role. The portlet also allows the user to drill-down further into the role and separate the hours by primary skill. This portlet leverages the timeslices, and pulls availability from resources and allocation from the team records. The user is able to narrow the results by filtering on start/finish date, time period, active projects, and active resources. Using this portlet, a resource manager can quickly determine resource needs, skill needs, and overall allocation/availability of roles.


Copyright 2023 • Rego Consulting Corporation • Privacy Policy