-
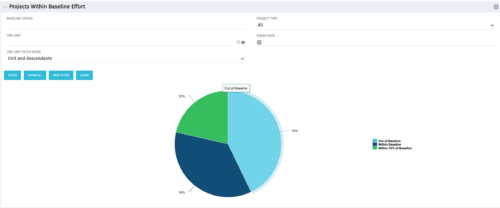 The Projects Within Baseline Effort portlet will display all projects’ baseline effort in a pie chart by three different categories: Out of Baseline, Within Baseline, and Within 10% of Baseline. This portlet is used by the PMO to provide management with a snapshot of all projects and their baselines.
 -
The Projects Within Baseline Effort portlet will display all projects’ baseline effort in a pie chart by three different categories: Out of Baseline, Within Baseline, and Within 10% of Baseline. This portlet is used by the PMO to provide management with a snapshot of all projects and their baselines.
-
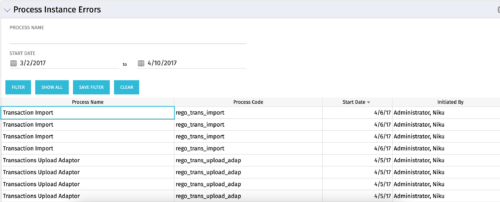 The Process Instance Errors portlet will show all processes that error. This portlet will assist the administrator with determining which processes are in error and whether to skip, retry, or cancel. It will display the process name, code, start date, and who initiated the process. You may also filter by any of the criteria listed in the grid.
 -
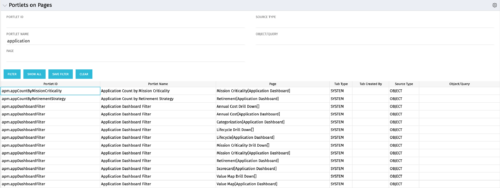 Portlets on Pages displays portlets located on each page within Clarity. This portlet is useful for administrators to determine which users have customized their pages and if they are not seeing a certain portlet, or if a user has placed a portlet on another page and needs help locating it. It also shows the portlet code, name, page the portlet resides on, tab type, who created the tab, source type, and the object/query.
 -
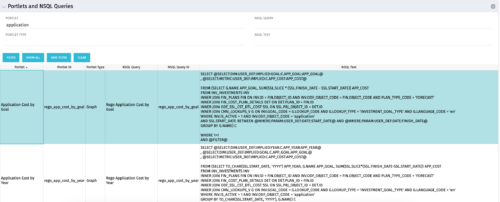 The Portlets and NSQL Queries portlet displays portlets built from queries. The portlet provides the administrator with the ability to search queries developed in the past that may have a certain attribute within it. This is helpful during upgrades when CA makes data model changes.
 -
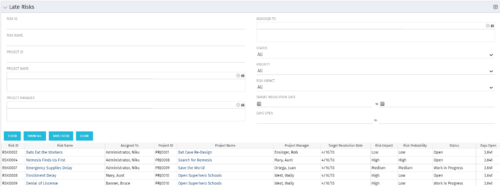 The Late Risks portlet displays all risks related to active projects that the logged in user has view rights to. The risks displayed are those that are past their target resolution date but not Closed or Resolved. The portlet provides a Project Manager the ability to view and track Risks across multiple projects without going into each project individually. This portlet displays the risk, the associated project name and project manager, as well as the risk owner, target resolution date, status, priority of the risk, and the total number of days the risk has been open.
 -
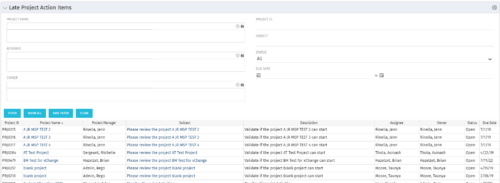 The Late Project Action Items portlet displays all action items related to active projects that the logged in user has view rights to. The action items displayed are those that are past their due date with a status of “In Progress” or “Open”. The portlet provides a Project Manager the ability to view and track action items across multiple projects without going into each project individually. In a single consolidated list, all late project action items can be easily viewed, along with the project with which they are associated, the individual assigned, and the owner of the action item.
 -
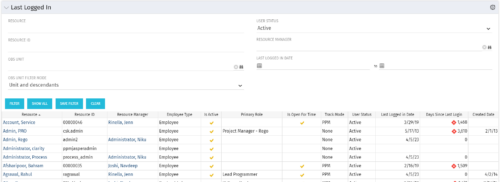 The Last Logged In portlet provides the administrator with an overview of all users within the system and the last time he or she logged into Clarity. Using this portlet, administrators can quickly cleanup any inactive users or provide a list of users to managers that are not logging into the system. The portlet provides several pieces of information related to the resource as well as a “Days Since Last Login” with a status indicator. The administrator may filter on resource/id, OBS, user status, resource manager, or last logged in date to narrow down the results.
 -
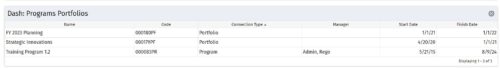 The Dashboard: Programs Portfolios portlet is placed on the dashboard page of a project. This portlet will show any programs or portfolios the project is a subproject of. The portlet will display the name, code, connection type, manager, and start/finish dates.
 -
 The Capacity Graph - Investment portlet displays Availability, Allocations, Assignments and Actuals for active resources in a single project. This portlet pulls from timeslices and allows the user to filter on weekly, monthly, or quarterly data. This portlet provides a Project Manager with a simple way to analyse: Allocations vs. Actuals and Allocations vs. ETC. Depending on metric goals, the graph allows the user to determine where areas of improvement may exist.
 -
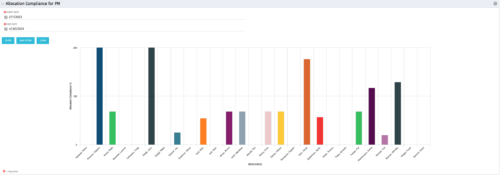 The Allocation Compliance by Person (Project Manager) portlet gives a view of resource allocation compliance for active resources on the team of an investment the logged in user is the manager for. It allows the PM to see resources on their project over the coming months and whether they are over or under allocated. This portlet leverages the daily allocation and daily availability slices as well as only active investments. The portlet provides filters for specific dates, filtering by resource ID, and resource name may also be added.
 -
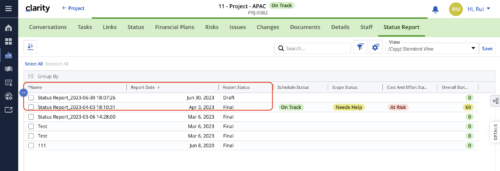 When marking a Status Report 'Final' in a grid/list view, the system doesn't create a new 'Draft' report like it does when using the Status Report UI. For groups that prefer to manage in a grid/list, they need to always have a draft.


Copyright 2023 • Rego Consulting Corporation • Privacy Policy