-
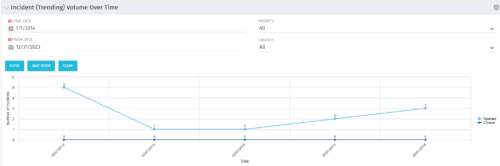 This view depicts trends of created and resolved Incidents over time, grouped by month. The count of incidents opened is determined by the Created Date of the Incident, and the count of Incidents closed is determined by the Resolution Date of the Incident. The view is filterable by Priority and Urgency as well as a date range. NOTE: The values returned are the total sum for a given month, not a cumulative total over time.
 -
This view depicts trends of created and resolved Incidents over time, grouped by month. The count of incidents opened is determined by the Created Date of the Incident, and the count of Incidents closed is determined by the Resolution Date of the Incident. The view is filterable by Priority and Urgency as well as a date range. NOTE: The values returned are the total sum for a given month, not a cumulative total over time.
-
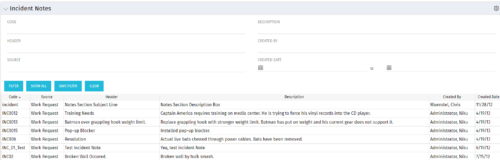 The Incident Notes portlet displays all of the notes that have been entered against Incidents in a single view. This allows users to more efficiently look at the notes, regardless of security rights, without having to enter each incident individually to view them.
 -
The Incident Notes portlet displays all of the notes that have been entered against Incidents in a single view. This allows users to more efficiently look at the notes, regardless of security rights, without having to enter each incident individually to view them.
-
The Incident Notes portlet displays all of the notes that have been entered against Incidents in a single view. This allows users to more efficiently look at the notes, regardless of security rights, without having to enter each incident individually to view them.
-
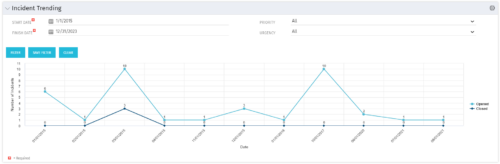 The Incident Trending portlet all opened and closed incidents within a certain time frame. This portlet will show trends in incidents over previous months and allows for analysis of as to the root cause in a spike of incidents. The information may be filtered by date range, urgency and priority.
 -
The Incident Trending portlet all opened and closed incidents within a certain time frame. This portlet will show trends in incidents over previous months and allows for analysis of as to the root cause in a spike of incidents. The information may be filtered by date range, urgency and priority.
-
The Incident Trending portlet all opened and closed incidents within a certain time frame. This portlet will show trends in incidents over previous months and allows for analysis of as to the root cause in a spike of incidents. The information may be filtered by date range, urgency and priority.
-
 Are you struggling to get data compliance within your instance of Clarity? This class will talk about common compliance problems and discuss potential solutions to help your increase compliance within your organization.
 -
 Do you want to know more about building file-based integrations? Does your organization have an external BI tool like Cognos, Tableau, Domo, or Qlikview? This session will review strategies for getting data into your corporate BI tools. We will also show Rego's data extraction tool and how it can be used for all outbound file-based integrations to save money and time.
 -
 Do you want to add REST interfaces to your Clarity instance? We’ll walk you through specific custom interface examples in GEL and showcase Rego’s Data Processor REST capabilities you can leverage to reduce the time and cost of implementation.


Copyright 2023 • Rego Consulting Corporation • Privacy Policy