-
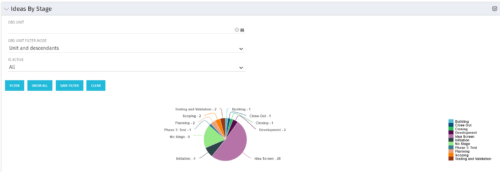 Pie Chart displays count of all Ideas by stage. Filterable by Active and Inactive, and also by OBS. Data label and mouse-over show Stage counts. Legend displays Stage names. This portlet assumes the use of the custom Stage attribute on Idea object.
 -
Pie Chart displays count of all Ideas by stage. Filterable by Active and Inactive, and also by OBS. Data label and mouse-over show Stage counts. Legend displays Stage names. This portlet assumes the use of the custom Stage attribute on Idea object.
-
Pie Chart displays count of all Ideas by stage. Filterable by Active and Inactive, and also by OBS. Data label and mouse-over show Stage counts. Legend displays Stage names. This portlet assumes the use of the custom Stage attribute on Idea object.
-
 Pie Chart displays count of all Ideas by Department. Filterable by Active and Inactive, by OBS, and by Department Manager. Data label and mouse-over show department counts. Legend displays department names.
 -
Pie Chart displays count of all Ideas by Department. Filterable by Active and Inactive, by OBS, and by Department Manager. Data label and mouse-over show department counts. Legend displays department names.
-
Pie Chart displays count of all Ideas by Department. Filterable by Active and Inactive, by OBS, and by Department Manager. Data label and mouse-over show department counts. Legend displays department names.
-
 Pie Chart displays total Ideas by Priority, filterable by Active / Inactive and by OBS structure. Data Label and Mouse-over label display counts by Priority. Legend shows Priority Name. Chart also shows Ideas with No Priority.
 -
Pie Chart displays total Ideas by Priority, filterable by Active / Inactive and by OBS structure. Data Label and Mouse-over label display counts by Priority. Legend shows Priority Name. Chart also shows Ideas with No Priority.
-
Pie Chart displays total Ideas by Priority, filterable by Active / Inactive and by OBS structure. Data Label and Mouse-over label display counts by Priority. Legend shows Priority Name. Chart also shows Ideas with No Priority.
-
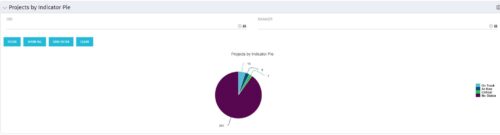
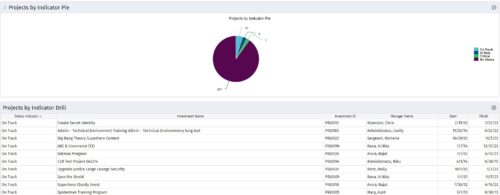 Pie Chart displays counts of all projects by out-of-box Status Indicator attribute. Filterable by OBS structure and Manager. Data label displays count. Mouse-over and Legend display Indicator name. Chart also displays count for projects with no Indicator. By clicking on a pie slice, a grid portlet appears displaying all projects with that indicator value.
 -
Pie Chart displays counts of all projects by out-of-box Status Indicator attribute. Filterable by OBS structure and Manager. Data label displays count. Mouse-over and Legend display Indicator name. Chart also displays count for projects with no Indicator. By clicking on a pie slice, a grid portlet appears displaying all projects with that indicator value.
-
Pie Chart displays counts of all projects by out-of-box Status Indicator attribute. Filterable by OBS structure and Manager. Data label displays count. Mouse-over and Legend display Indicator name. Chart also displays count for projects with no Indicator. By clicking on a pie slice, a grid portlet appears displaying all projects with that indicator value.


Copyright 2023 • Rego Consulting Corporation • Privacy Policy