-
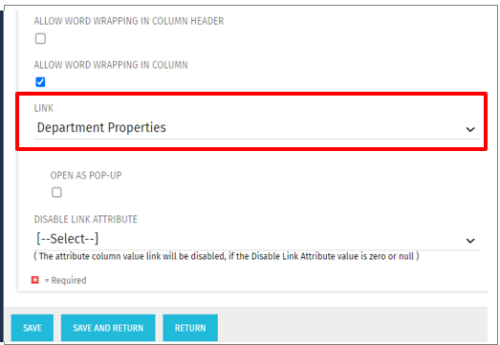 This Tech Trick allows the ability to link anywhere within the larity environment from a custom portlet link, even if it is not a standard OOTB link option. For example, you could link to a Departments page or directly to a timesheet even though these are not standard OOTB links to choose from when creating custom portlets. This trick works in Clarity versions 12, 13 , 14 and 15 for both SQL and Oracle environments.
 -
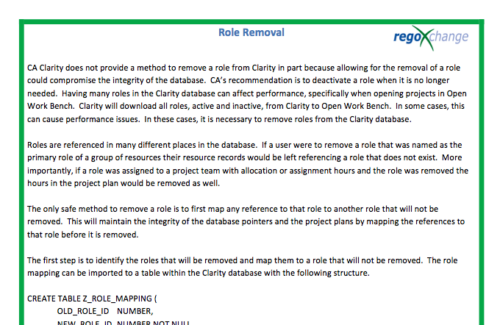 In many instances, having excess information stored within the database can cause poor performance or slowness when retrieving data. Administrators are always seeking out ways to clean and remove unused information. This technical trick on role removal provides the steps necessary to remove roles that would otherwise be unused and eliminating unwanted information. The Role Removal Technical Trick provides the information for the creation of the following tables and columns which are necessary to perform the role removal:
- Role – mapping table
- Tables / Columns that need to be updated with Resource ID fields
- Tables / Columns that need to be updated with Role Code fields
- Tables that will need to be deleted
- PRTEAM table should be checked
-
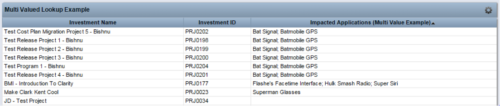 The Concatenate Multi-Value Lookup into One Field for Display Purposes technical trick provides an overview of how to group or concatenate the various levels and values of a Multi-Value lookup into one field in both Oracle and SQL Server environments. This allows the lookup values to be more easily displayed in a portlet. The function concatenates the values together using a choice of delimiter, which then allows the multi-value lookup to be viewed as one portlet column, in the same manner as any other object attribute.
 -
 This solution provides an administrator the ability to log into the CA Clarity application as any user in the system. This ability is especially helpful when troubleshooting user issues and security settings. (Will not work with On-Demand Instances.)
 -
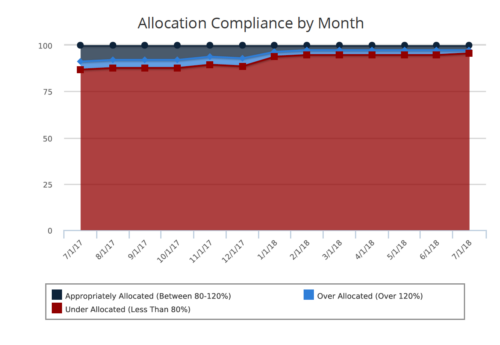 Allocation Compliance Area Chart provides the resource manager a single place to view the Monthly Resource Allocation compliance for all resources in the form of an Area chart. Allocation Compliance is calculated based on the value of 'Availability to Allocation Hours %' Allocation Compliance is 'Under Allocated (Less Than 80%)' WHEN 'Availability to Allocation Hours %’ is less than 80 Allocation Compliance is 'Appropriately Allocated (Between 80-120%)' WHEN 'Availability to Allocation Hours %' is between 80 and 120 Allocation Compliance is 'Over Allocated (Over 120%)' WHEN 'Availability to Allocation Hours %' is greater than 120 User can further narrow their search by Resource Is Active?, OBS Type, OBS Path and Month Start Date. User can use exact dates or relative dates for Month Start Date filter parameter.
 -
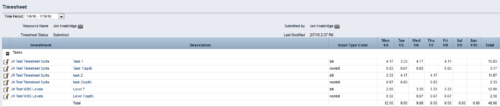
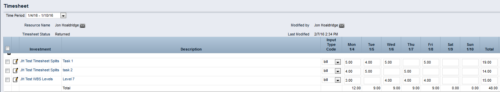 The Timesheet Smoothing Process Workflow kicks-off when an individual timesheet is Submitted. It splits each transaction on the timesheet when total timesheet actuals exceed total weekly availability for the resource. Total weekly availability is determined by multiplying resource availability rate by the number of workdays in the week. Non-workdays include weekends, holidays, PTO, and other scheduled days off, as set on the resource calendar. If timesheet actuals <= total weekly availability, then the timesheet remains unchanged. But if timesheet actuals > total weekly availability, then the following occurs. Each timesheet transaction is reduced by a calculated percentage that will reduce the total regular hours to equal the total weekly availability. Then the remaining transaction hours are placed in a “Split” row for that task on that day, with an Input Type Code set based on a process parameter (which parameter can be set within the script action on the process). Note: If a single day has overtime hours, but the total timesheet actuals <= total weekly availability, no splitting occurs.
 -
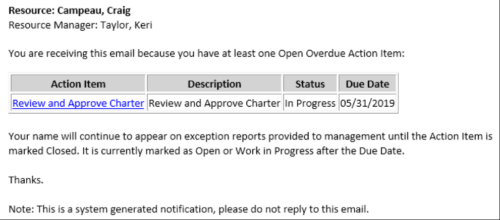 This Process sends an email to every Action Item Assignee where the Due Date/Time has passed and the Status is either Open, or In Progress. Users may want to modify this stalker to include Status = Deferred. In addition, the Resource Manager for the Assignee receives a copy of the email. In order to generate emails, the SMTP gateway must be up and running and Resources must have a valid email address.
 -
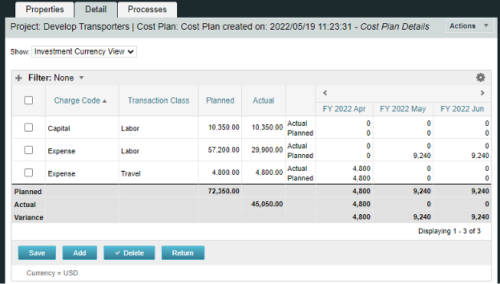
A process creating a new Cost Plan. Cost Plan properties:
Pre-conditions:Name Cost Plan created on: yyyy/mm/dd hh:mm:ss Grouping attributes Charge Code, Transaction Type Start Period The earliest fiscal period with Actuals (from PPA_WIP table) or current period, if there are no actuals Finish Period The latest fiscal period with a non-zero allocation (from PRJ_BLB_SLICES table, SLICE_REQUEST_ID = 6 Period Type Monthly Plan of Record True Planned Cost For periods in the past – from Actuals (Charge Code, Transaction Type, Quantity (Units), Cost (Amount) taken from Transactions (PPA_WIP & PPA_WIP_DETAILS); For current and future periods – from Allocations (Charge Code taken from the Project, Transaction Class from the Resource, Quantity from allocation slices, Cost from the Rate Matrix (NBI_PROJ_RES_RATES_AND_COSTS table) - the Project must be financially enabled.
- if a new Team Member is added, Rate Matrix job must be run, so the rates are populated in the NBI table.
- if the Allocation changes, allow the timeslice job to finish before running the process.
- the Project should have the Charge Code set.
-
 This can be used to remove all automatic permissions (Project Manager Auto) granted to users as a result of becoming a project manager. NOTE: The ability to remove the right is with the admin only.
 -
 A process that:
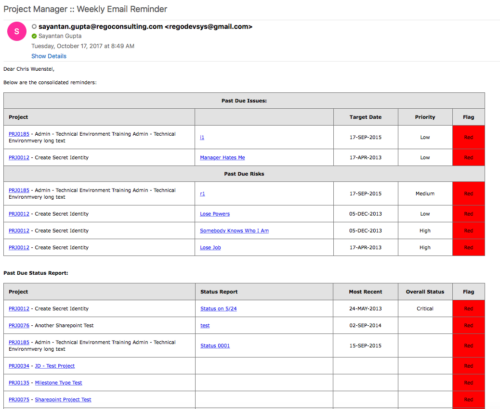
- is a weekly email to a project manager. All of the content will be for where the person getting the email is the PM
- shows aggregate data for all of their projects
- sends the PM a reminder email at the end of each week showing the items that the PM needs to do. Maybe call it Weekly PM reminder.
- Shows the mentioned data in sections as follows:
- Past Due issues
- Only active projects
- Only open issues – not resolved or closed
- Show project name, project ID, issue name, issue priority, target resolution date, color (only red or yellow)
- Logic for Yellow = where target resolution is within the next week
- Logic for Red = target resolution date is in the past
- URL LINK: to that issue
- Past Due Risks
- Only active projects
- Only open risks – not resolved or closed
- Show project name, project ID, risk name, risk priority, target resolution date, color (only red or yellow)
- Logic for Yellow = where target resolution is within the next week
- Logic for Red = target resolution date is in the past
- URL LINK: to that risk
- Past Due Status Report
- Only active projects
- Show project name, project ID, report date, most recent overall status, color (only red or yellow)
- Only 1 line per project – show even if there is no status report
- Logic for Yellow = where latest status report date > 7 days ago
- Logic for Red = latest status report date is > 14 days ago
- URL LINK: to status report list
- Past Due Milestones
- Only active projects
- Only open milestones
- Show project name, project ID, task name, task finish date, color (only red or yellow)
- Logic for Yellow = where finish is within the next week
- Logic for Red = finish date is in the past
- URL LINK: to that milestone
- Past Due Forecast
- Only active projects
- Show project name, project ID, last updated date, most recent total plan of record amount, color (only red or yellow)
- Only 1 line per project – show even if there is no finish plan
- Logic for Yellow = where last updated date of the plan of record > 14 days ago
- Logic for Red = where last updated date of the plan of record > 30 days ago
- URL LINK: to cost plan
- Allocation Summary for the Project Team
- Past Due issues
- Unfilled Roles that need to be staffed
- Resources Actuals +/- 25% of Allocation
- Resource ETC +/- 25% of Allocation
- Pending Change Controls / Approval Status
- In addition to the Past Due Milestones, upcoming milestones
- Budget Summary
- Actual vs. Planned
- Burndown estimate
-
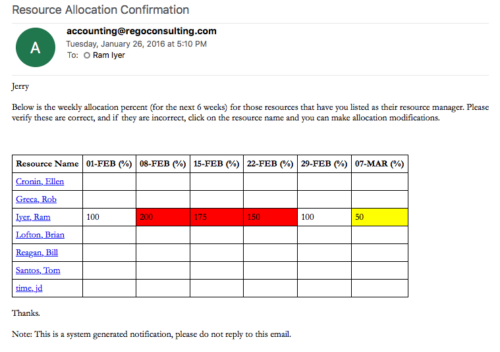 Process sends an email to RM, for resources assigned, that indicates the allocation percentage for each resource for the next 6 weeks. Email has links to each resource so that allocation modifications can be made as required.
 -
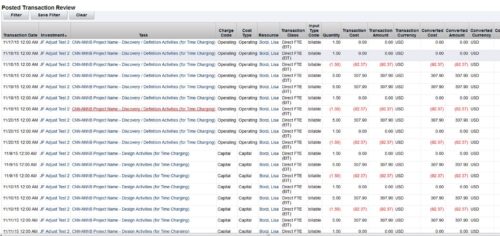 This is an automation to adjust the cost in financials (WIP) based on the standard weekly hours for salaried (Exempt) personnel. The process adjusts only the cost in WIP where the hours per week that are posted for a resource are more than the standard work week. The Posted hours in the timesheet and in WIP remain untouched. For the process to calculate correctly, all time in a given week needs to be accounted for, including all non-project time. The process has three input parameters as explained below:
- wkStdHour: Standard Weekly Hours; this can be changed in the process gel script. The parameter is based on the organization standard work week. The default is set to 40 hours.
- xogBatchSize: The XOG batch size. This is used to upload data in batches to avoid high memory and performance issues. The default batch size is set to 50 records.
- username: The resource name that the process uses for uploading data. The default is set to admin.
- It will process all the timesheets in posted state provided the timesheet has not been adjusted earlier by this process and there are no pending transactions to be posted for it. Validation is made based on Notes field, which is populated once adjustment is done by the process.
- Notes field should not be modified in Script nor should be worked upon by any other process.
- All the invalid transactions should be cleared and post to WIP should be finished with no pending records.


Copyright 2023 • Rego Consulting Corporation • Privacy Policy